From Raw Data to Grouped Data
In Class 9 you found the mean, median and mode of ungrouped data (a plain list of numbers). Real surveys, though, usually come grouped into class intervals like 10-25, 25-40, and so on, with a frequency telling how many observations fall in each class.
To work with grouped data we replace every class by a single representative value — its class mark:
xi=2lower limit+upper limit.
For example, the class 40-55 has class mark 240+55=47.5.
Key Point: The class mark is the midpoint of the class. We treat every value in a class as if it were located at its class mark.
The Direct Method for the Mean
Once each class has a class mark xi and a frequency fi, the mean of grouped data is the total of fixi divided by the total frequency:
xˉ=∑fi∑fixi
How to set it up: make a table with columns for the class, the frequency fi, the class mark xi, and the product fixi. Add up the fi column (that is n=∑fi) and the fixi column, then divide.
Key Point: ∑fi=n is the total number of observations, and xˉ=n∑fixi.
A Worked Table
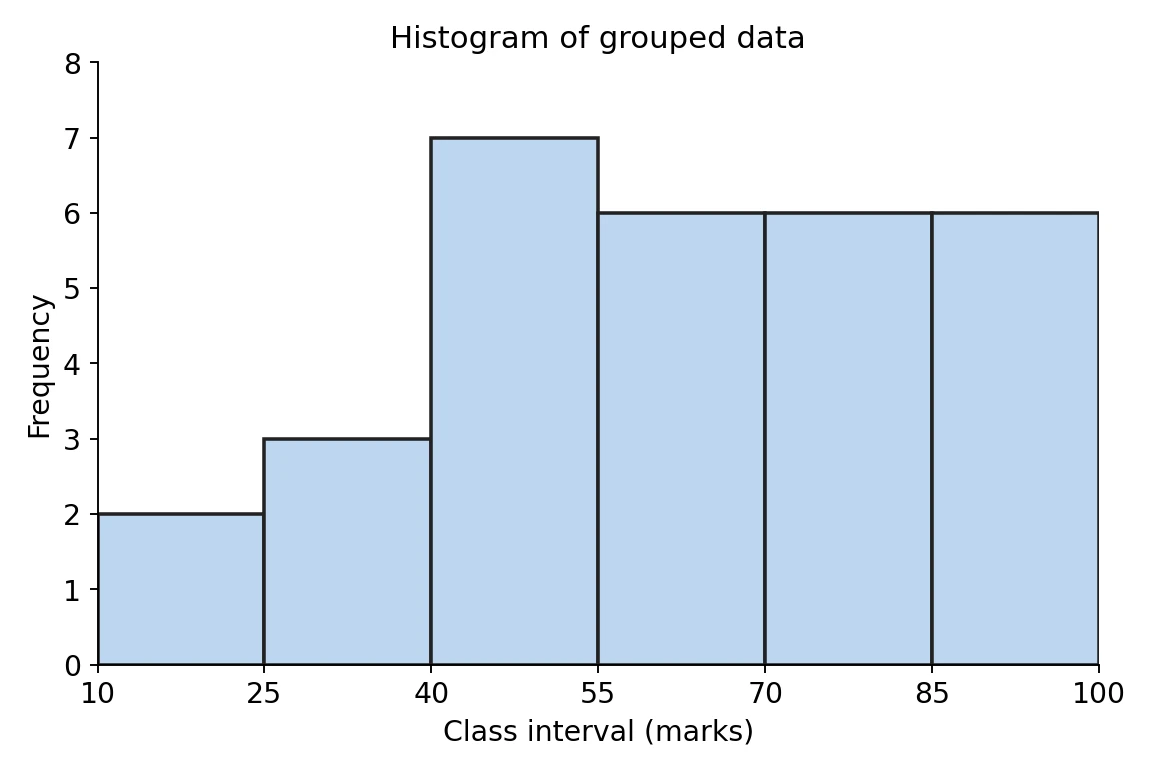
Marks of 30 students:
| Class |
fi |
xi |
fixi |
| 10-25 |
2 |
17.5 |
35 |
| 25-40 |
3 |
32.5 |
97.5 |
| 40-55 |
7 |
47.5 |
332.5 |
| 55-70 |
6 |
62.5 |
375 |
| 70-85 |
6 |
77.5 |
465 |
| 85-100 |
6 |
92.5 |
555 |
| Total |
30 |
|
1860 |
xˉ=∑fi∑fixi=301860=62.
[Board Important] So the mean mark is 62. We will reuse this same table for the mode and median later, so notice its shape.
Solved Examples
Example 1: Direct method
Find the mean of the distribution: classes 0-10,10-20,20-30,30-40 with frequencies 4,6,8,2.
Solution:
- Class marks: 5,15,25,35.
- fixi: 20,90,200,70; ∑fixi=380; ∑fi=20.
- xˉ=20380=19.
Final Answer: Mean =19.
Takeaway: Class mark = midpoint; multiply by frequency, add, divide.
Example 2: Class marks
Write the class marks of the classes 100-120,120-140,140-160.
Solution:
- 2100+120=110, 2120+140=130, 2140+160=150.
Final Answer: 110,130,150.
Takeaway: The class marks of equal classes are themselves equally spaced (here by 20).
Example 3: Find a missing frequency
The mean of the following is 18. Find the missing frequency f: classes 11-13,13-15,15-17,17-19,19-21 with frequencies 3,6,9,13,f; class marks 12,14,16,18,20.
Solution:
- ∑fi=31+f; ∑fixi=36+84+144+234+20f=498+20f.
- xˉ=18⇒31+f498+20f=18⇒498+20f=558+18f.
- 2f=60⇒f=30.
Final Answer: f=30.
Takeaway: Set ∑fi∑fixi=xˉ and solve for the unknown frequency.
Example 4: Daily wages
Find the mean daily wage: 500-520,520-540,540-560,560-580,580-600 with frequencies 12,14,8,6,10.
Solution:
- Class marks: 510,530,550,570,590.
- fixi: 6120,7420,4400,3420,5900; total =27260; ∑fi=50.
- xˉ=5027260=545.2.
Final Answer: Mean daily wage = Rs 545.20.
Takeaway: The direct method works for any grouped data — the arithmetic is just larger here.
