
Two Kinds of Cumulative Frequency Distribution
A cumulative frequency distribution can be written two ways:
- Less-than type: for each class, how many observations are less than its upper limit. The cumulative counts increase down the table.
- More-than type: for each class, how many observations are greater than or equal to its lower limit. These counts decrease down the table.
Both describe the same data — just accumulated from opposite ends.
Drawing an Ogive
An ogive (cumulative frequency curve) is the graph of a cumulative frequency distribution — a smooth free-hand curve, not straight-line bars.
- Less-than ogive: plot the points (upper class limit, cumulative frequency) and join them with a smooth rising curve.
- More-than ogive: plot the points (lower class limit, cumulative frequency) and join them with a smooth falling curve.
Key Point: Less-than upper limits, rising curve. More-than lower limits, falling curve.
Finding the Median from an Ogive
There are two graphical ways to read the median:
1. From one ogive. Mark on the cumulative-frequency (vertical) axis, draw a horizontal line to the less-than ogive, then drop a vertical line to the horizontal axis — that x-value is the median.
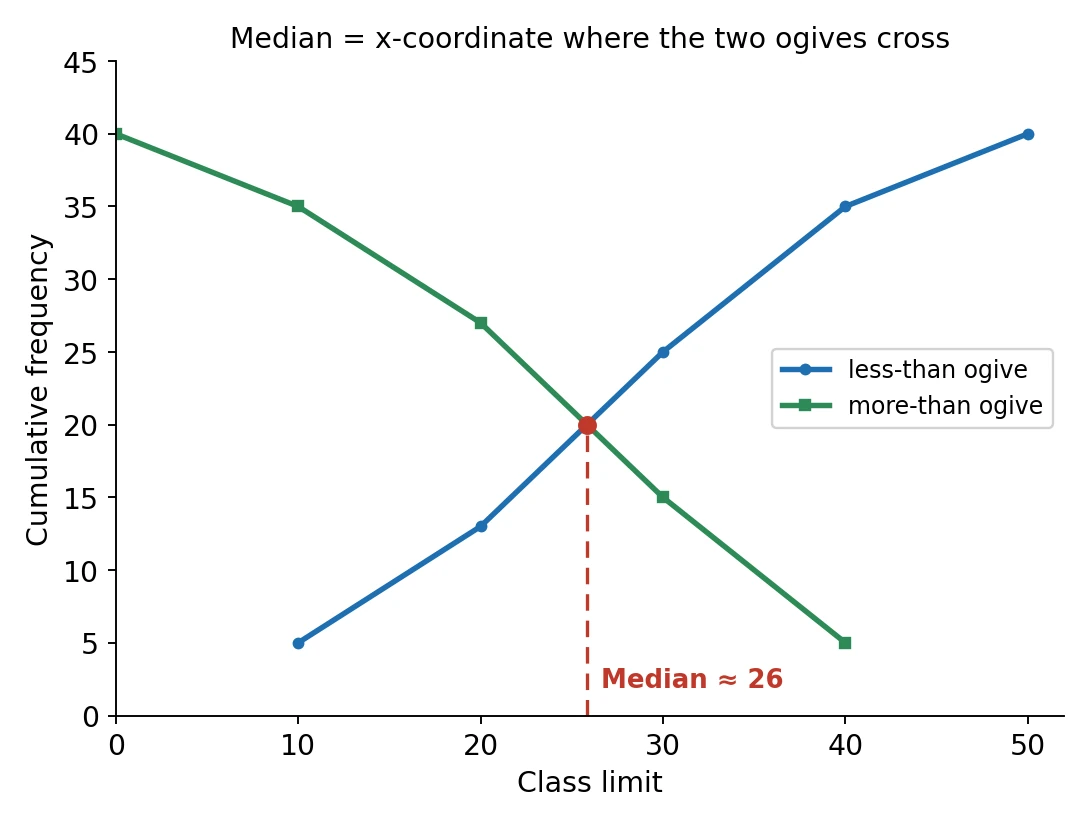
2. From both ogives. Draw the less-than and more-than ogives on the same axes. They cross at one point; the x-coordinate of that intersection is the median.
Key Point: The two ogives intersect at the median; equivalently, the less-than ogive reaches the median at height .
The Empirical Relationship
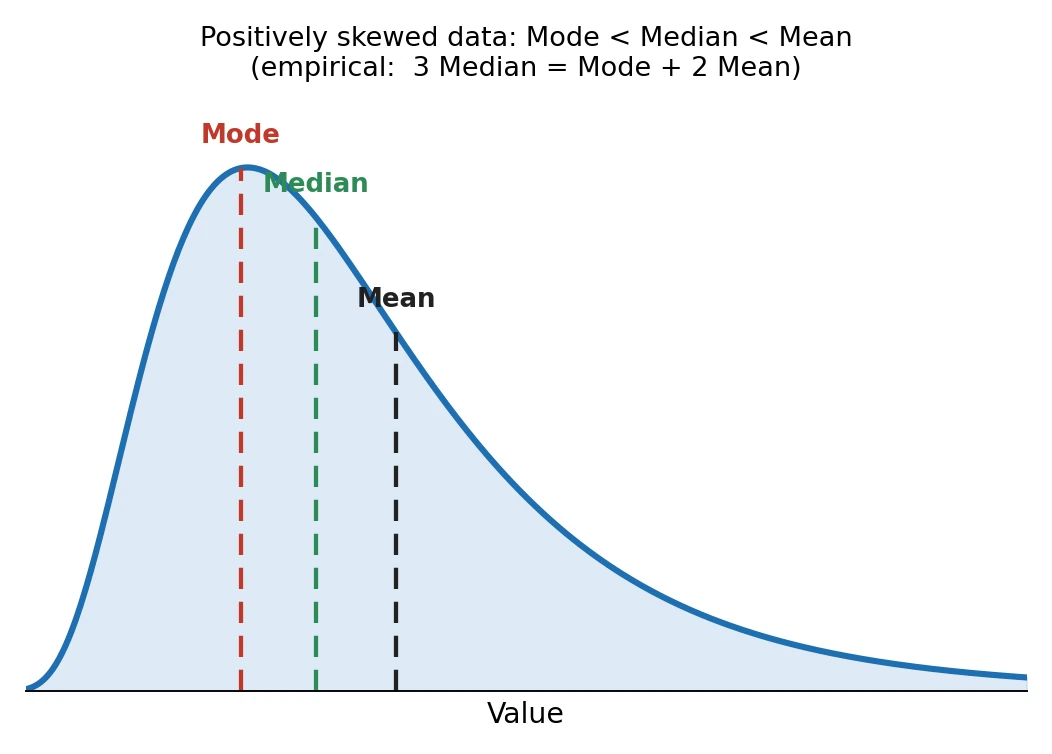
For a moderately (not too heavily) skewed distribution, the three measures are connected by an empirical relationship:
Rearranged, it lets you estimate any one from the other two:
[Board Important] This is approximate — use it only when the question asks you to estimate the third measure from the other two.
Solved Examples
Example 1: Empirical relation — find the mode
The mean of a distribution is 45 and its median is 48. Estimate the mode.
Solution:
- Mode .
Final Answer: Mode .
Takeaway: .
Example 2: Empirical relation — find the median
The mode of a distribution is 25 and its mean is 28. Estimate the median.
Solution:
- .
Final Answer: Median .
Takeaway: Rearrange .
Example 3: Building 'less than' points
From frequencies (classes ), list the points for a less-than ogive.
Solution:
- cf: .
- Less-than points (upper limit, cf): .
Final Answer: .
Takeaway: Plot cumulative frequency against the upper limits and join smoothly.
Example 4: Median from on the ogive
For the data of Example 3 (), where would you read the median on the less-than ogive?
Solution:
- . Draw a horizontal line from 20 on the cf-axis to the curve and drop to the x-axis.
- Between and the curve reaches cf ; by the median formula this is .
Final Answer: Median (read where the ogive is at height 20).
Takeaway: The ogive reading and the median formula agree.