Introduction
Visualizing trigonometric functions through their graphs is essential for understanding their properties like domain, range, periodicity, and for solving equations. The graph of a function is a visual representation of all the pairs (x, f(x)).
Graph of Sine Function ()
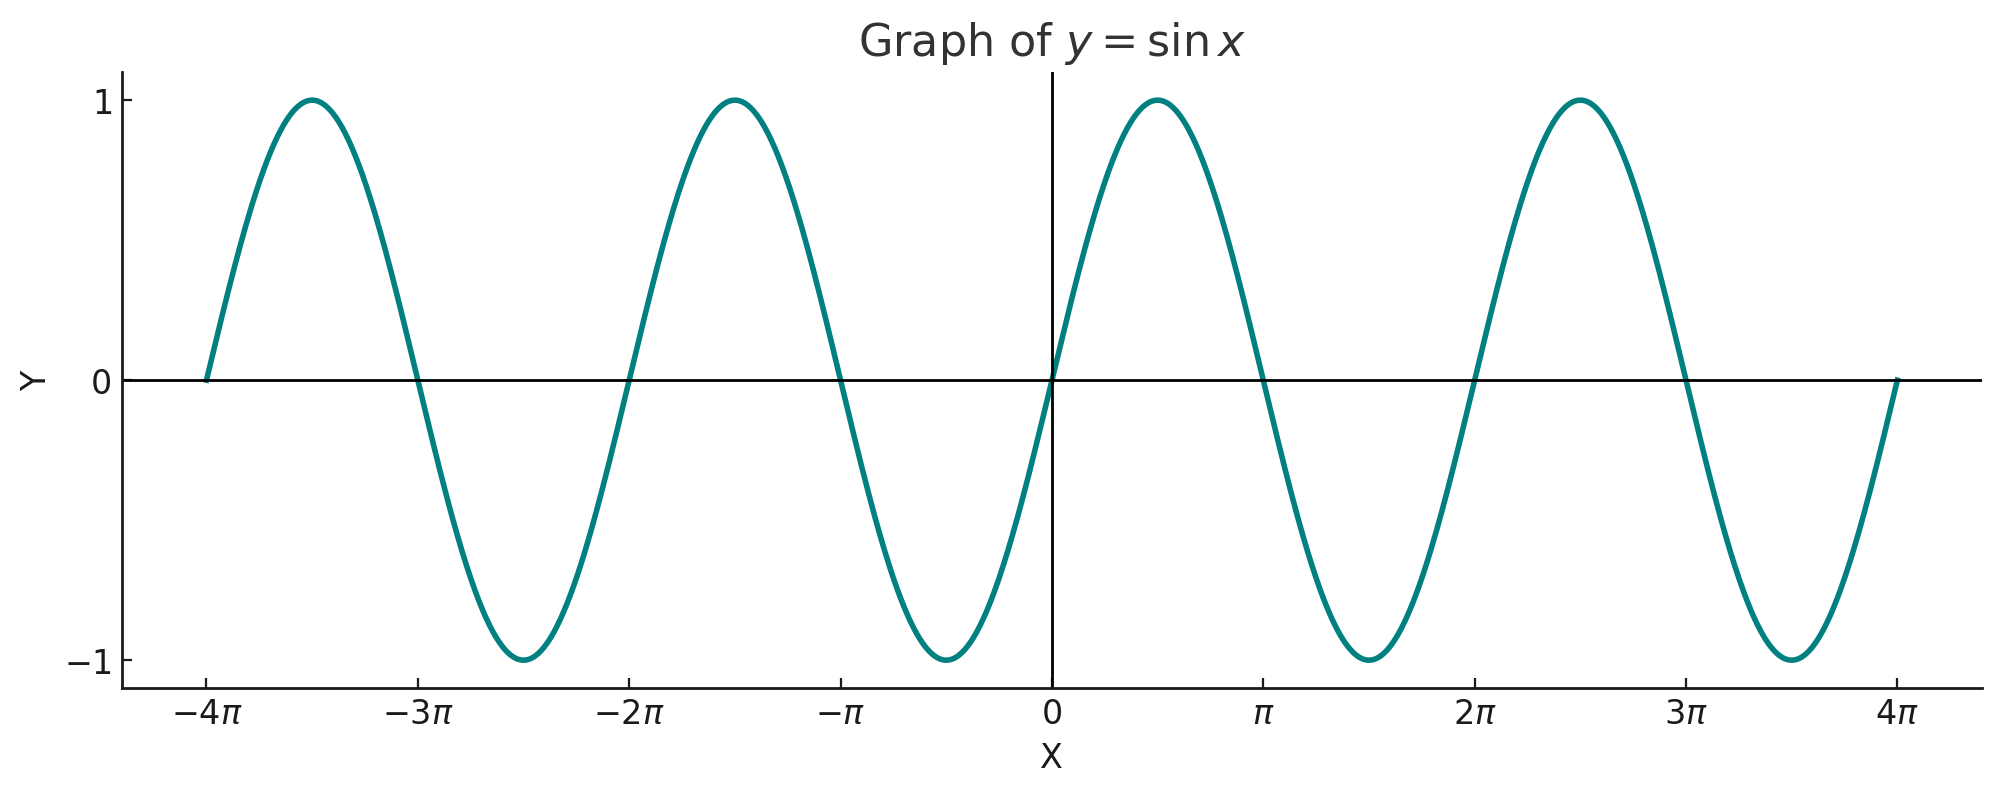
The graph of the sine function is a continuous, periodic wave that oscillates between -1 and 1.
- Domain: All real numbers ().
- Range:
- Period: . The graph repeats its pattern every radians.
- Symmetry: It is an odd function since , meaning it is symmetric about the origin.
Graph of Cosine Function ()
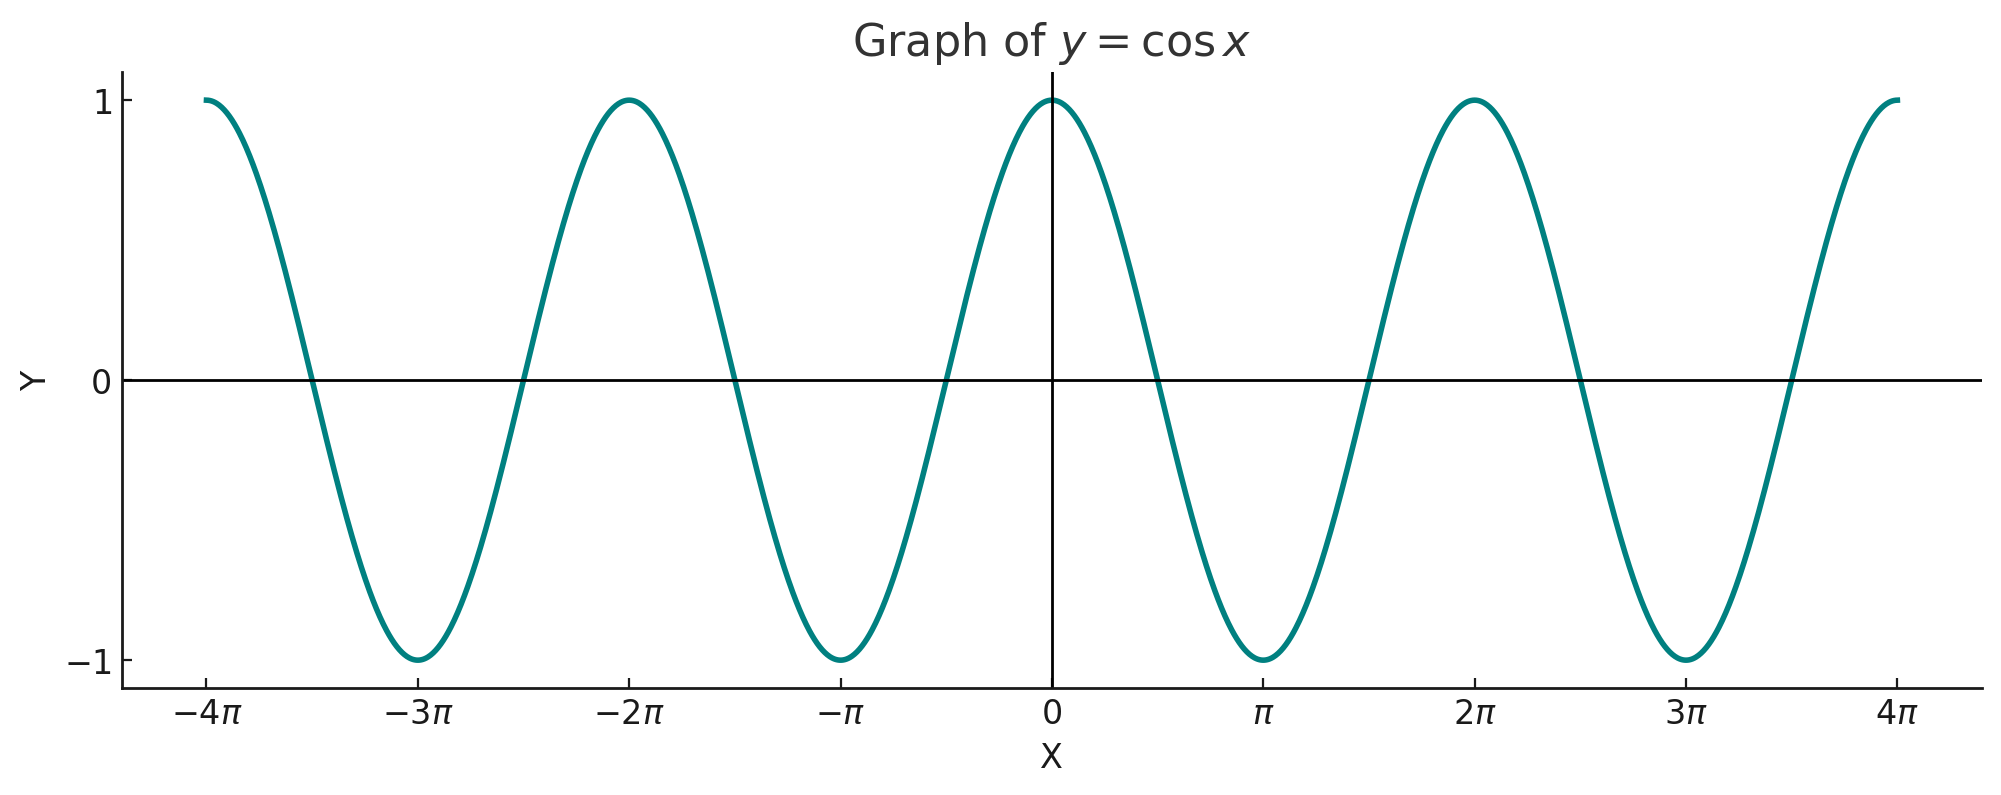
The graph of the cosine function is also a continuous wave, identical to the sine graph but shifted horizontally by .
Domain: All real numbers ()
Range:
Period:
Symmetry: It is an even function since , meaning it is symmetric about the y-axis.
Graph of Tangent Function ()
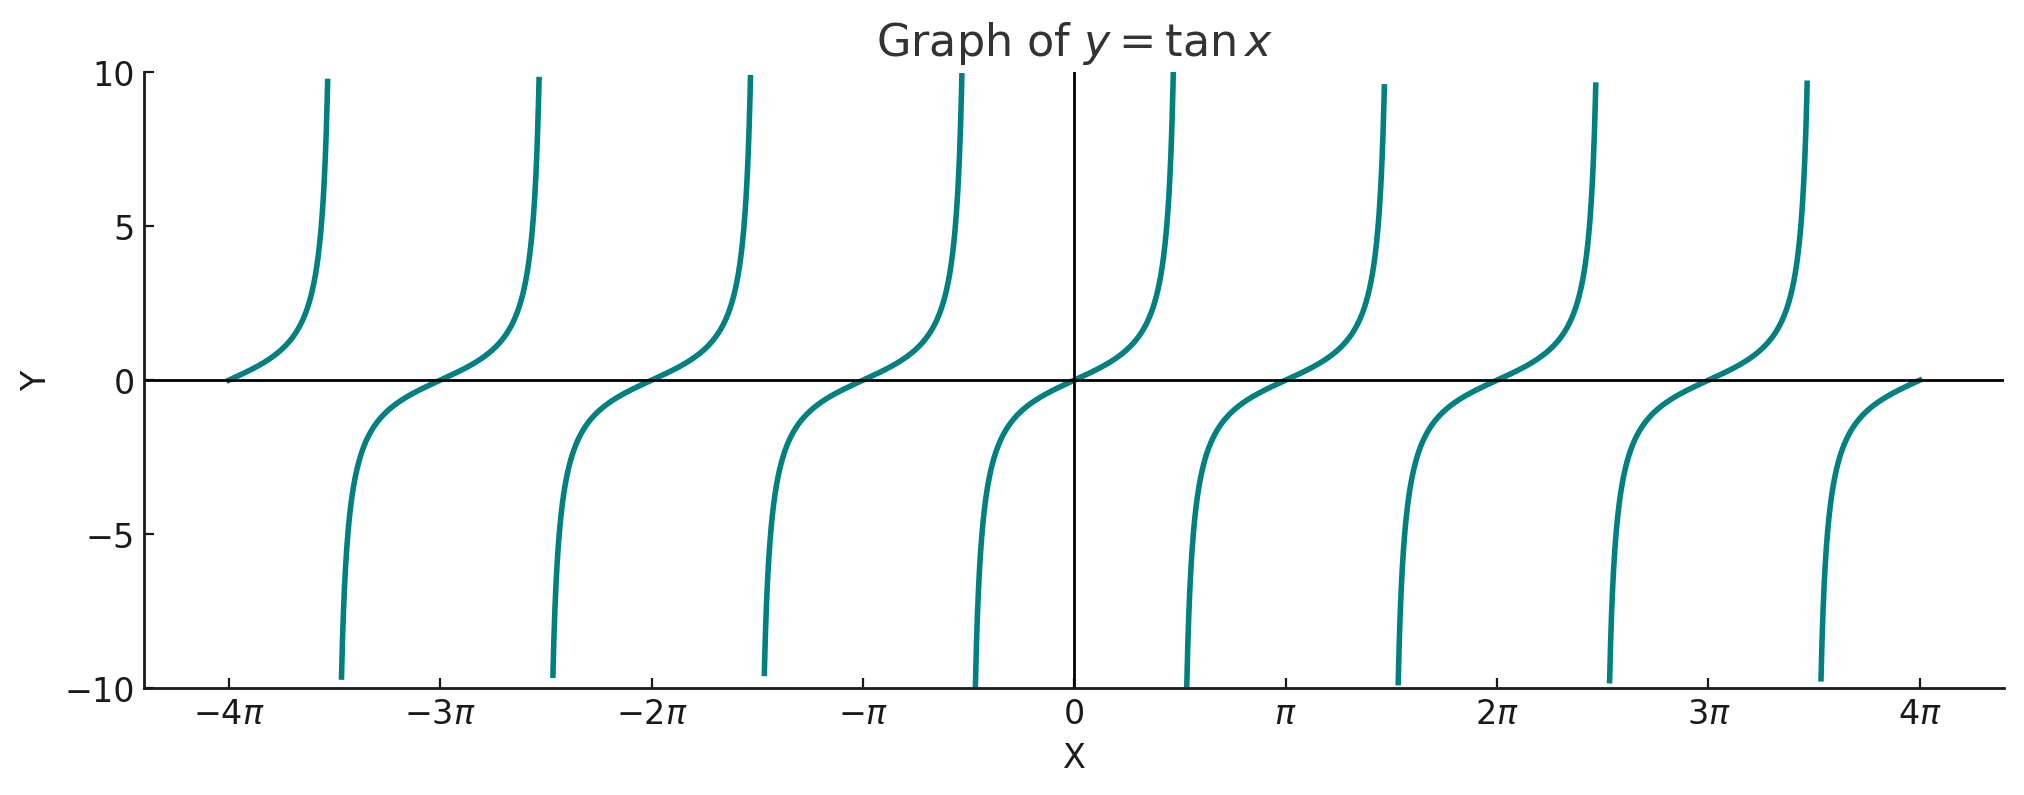
The graph of the tangent function is discontinuous and consists of repeating branches separated by vertical asymptotes.
Domain: All real numbers except odd multiples of . ()
Range: All real numbers ()
Period:
Asymptotes: Vertical lines at , where the cosine (denominator) is zero.
Transformations of Graphs
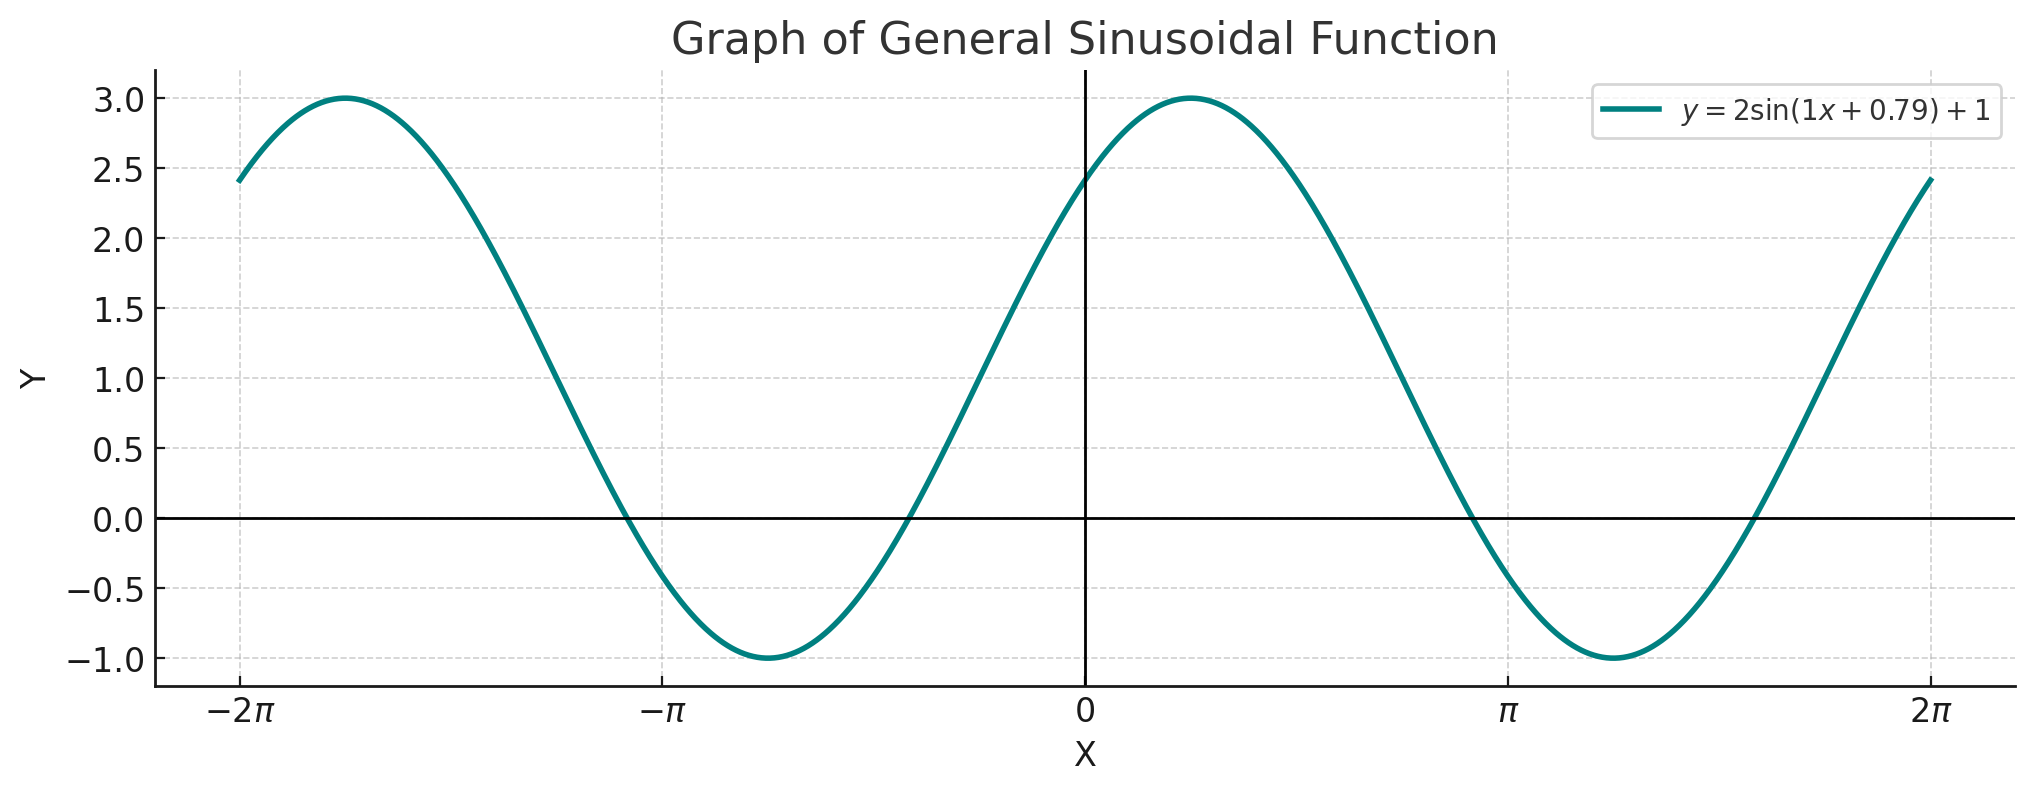
For a general sinusoidal function like :
- Amplitude (|A|): The maximum displacement from the central axis. It controls the vertical stretch of the graph.
- Period (): The length of one complete cycle. The value of B controls the horizontal stretch or compression.
- Phase Shift (): The horizontal shift of the graph. A positive value indicates a shift to the left, and a negative value indicates a shift to the right.
- Vertical Shift (D): The vertical shift of the graph's central axis.
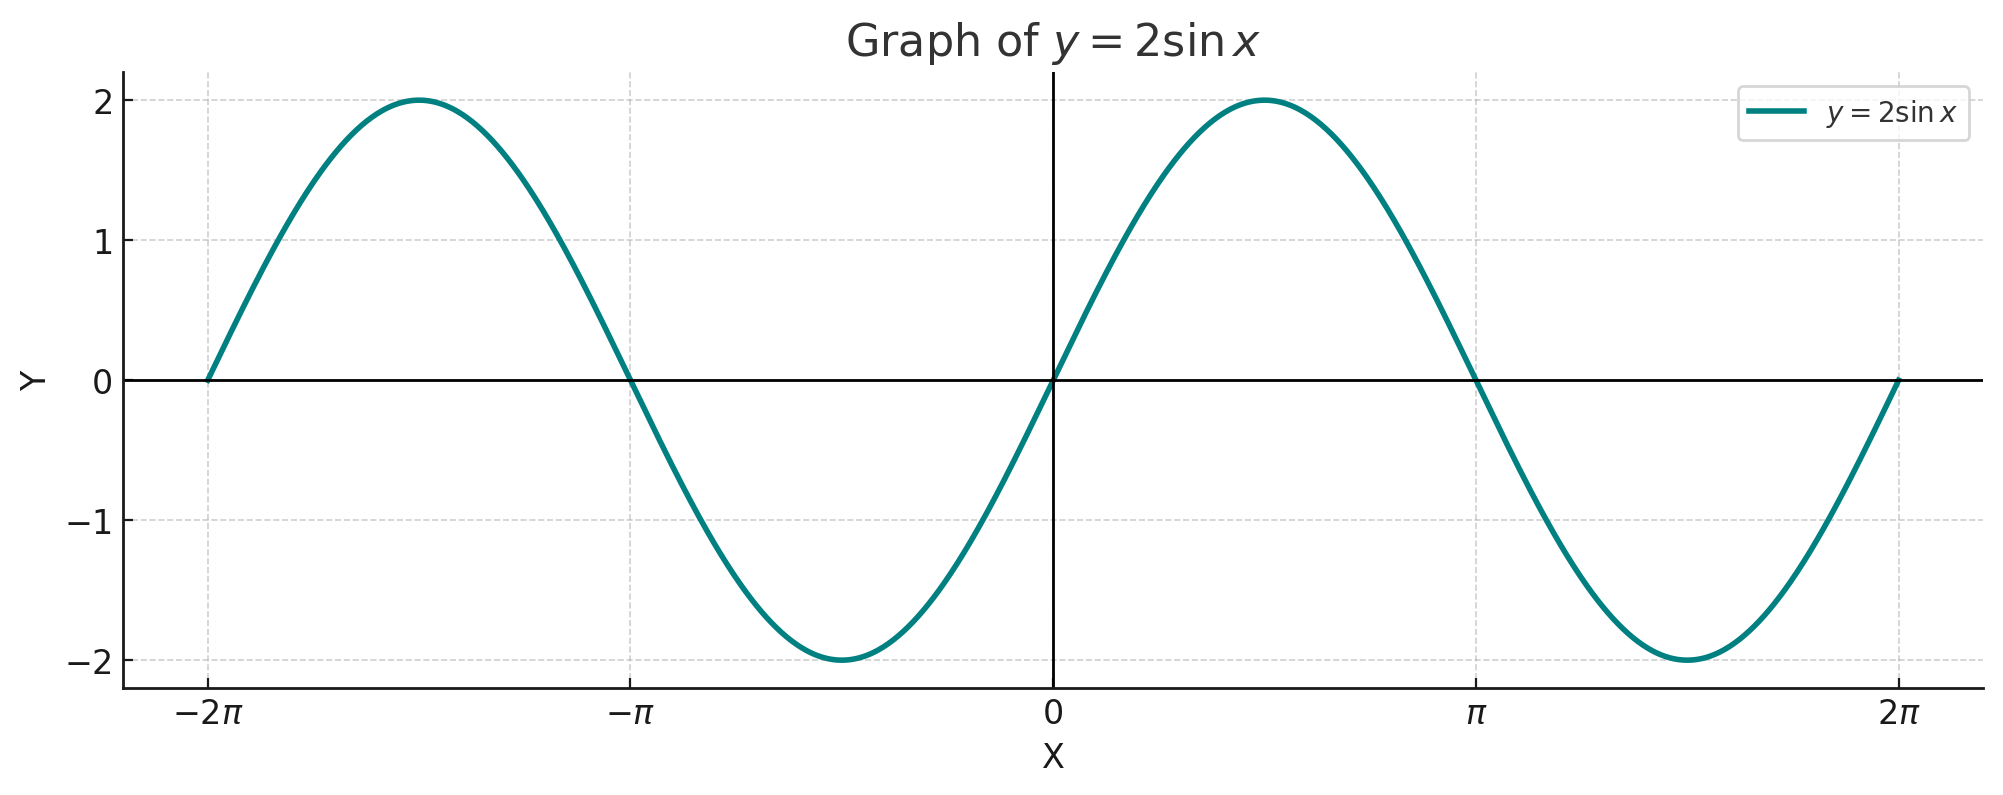
Example 1: Change in Amplitude
Question: Sketch the graph of .
Solution: This is a sine graph where the amplitude, A, is 2. The period and phase shift are unchanged. The range becomes , which is . The graph is vertically stretched by a factor of 2 compared to the standard graph. Its peaks are at y=2 and its troughs are at y=-2.
Example 2: Change in Period
Question: Find the period and sketch the graph of .
Solution: The period of this function is given by the formula . This means the cosine graph is horizontally compressed and completes one full cycle in the interval instead of . The range remains .
Example 3: Phase Shift
Question: Sketch the graph of .
Solution: This is a standard sine graph with a phase shift. The shift is . This represents a horizontal shift to the right by units. A standard sine wave starts its cycle at , but this one will start its cycle at .
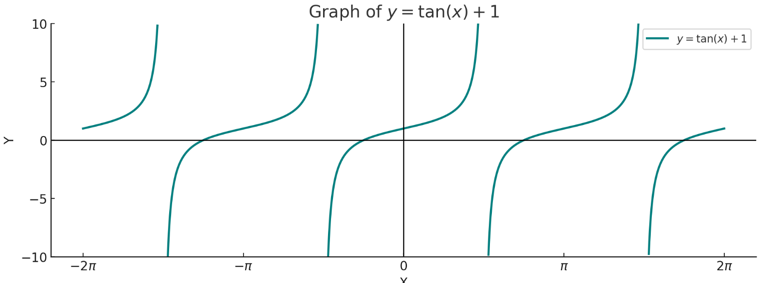
Example 4: Vertical Shift
Question: Sketch the graph of .
Solution: This is the standard tangent graph shifted vertically upwards by 1 unit. The domain, period (), and asymptotes remain the same. The point that was at the origin (0,0) is now at (0,1).
Example 5: Combined Transformation
Question: Find the domain, range, and period of the function .
Solution:
- Domain: The cosine function is defined for all real numbers, so the domain is .
- Range: The range of the base function is . The amplitude is 3, so the range of is . The vertical shift is +1, which shifts the range upwards by 1. The final range is .
- Period: The period is .
Example 6: Solving an Equation Graphically
Question: Find the number of solutions to the equation .
Solution: We sketch the graphs of and on the same axes. is a wave oscillating between -1 and 1. is a straight line passing through the origin with a slope of 0.1. The line will have values between -1 and 1 for the x-interval . Since , this interval contains slightly more than three full cycles of the sine wave. By sketching the graph, we can see the line intersects the sine curve once at the origin, three times for (in the intervals , , and one more before ), and three times for . The total number of solutions is .
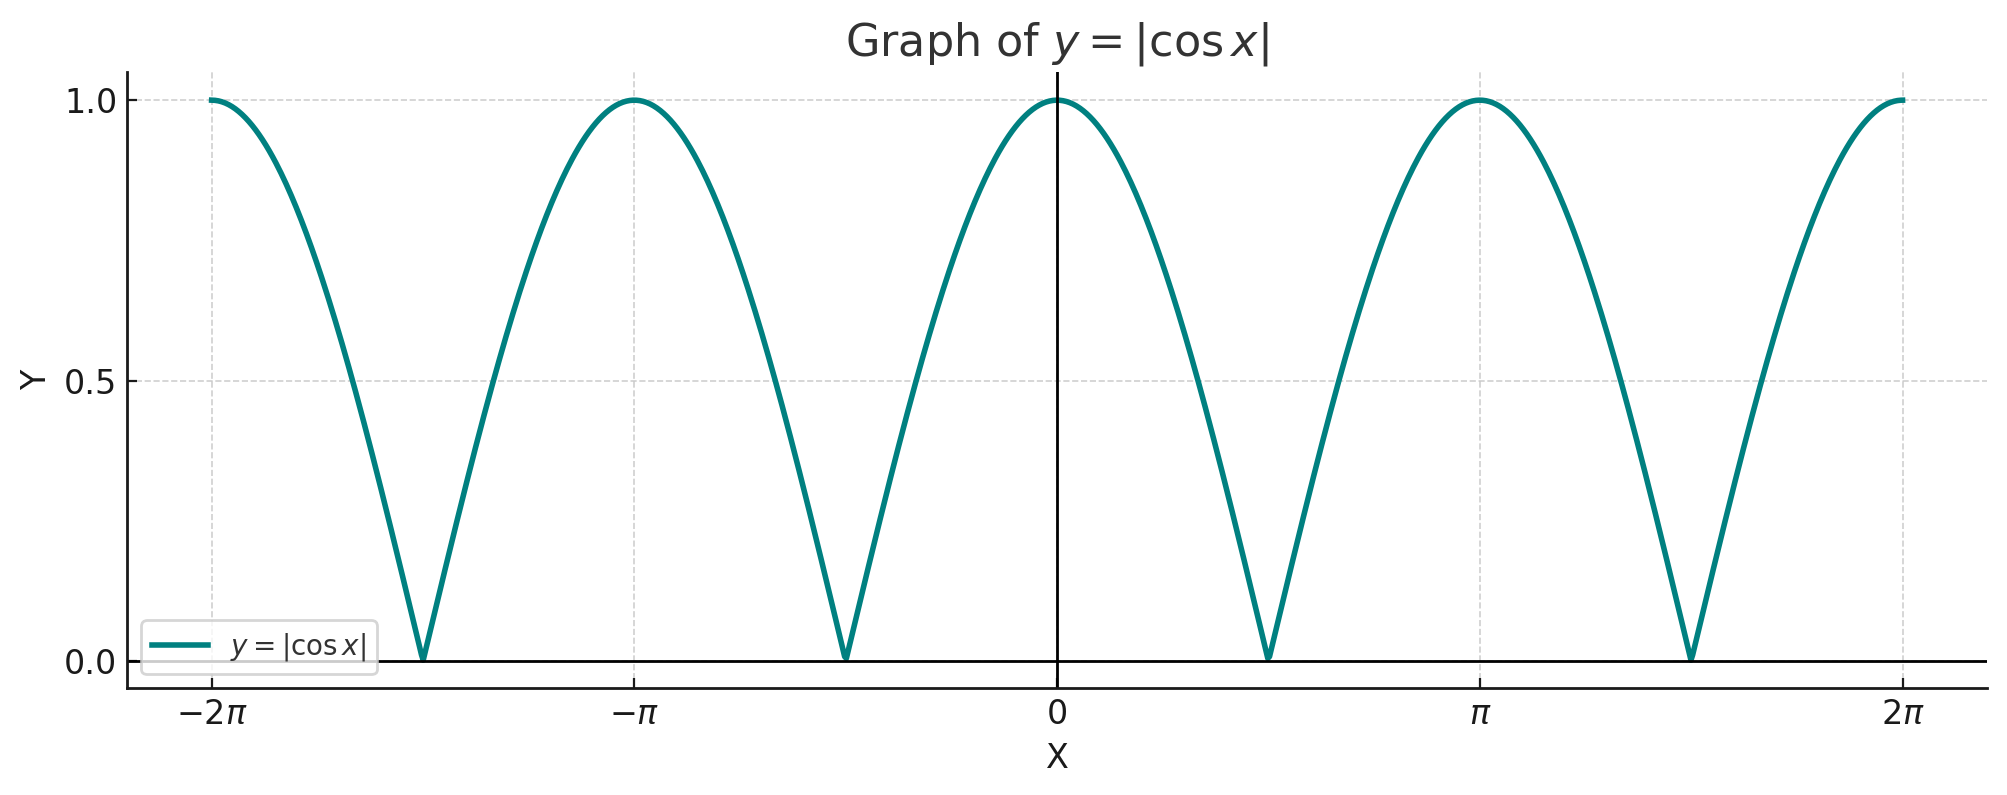
Example 7: Graph of Modulus Function
Question: Sketch the graph of and find its period.
Solution: To graph , we first draw the standard graph of . Then, we reflect any part of the graph that is below the x-axis to be above the x-axis. The resulting graph consists of a series of positive 'humps'. The standard period of is . After taking the modulus, the negative half of the wave (from to ) is reflected upwards, and the pattern now repeats every radians. The period of is .