
Humboldt's Observation
During his pioneering and extensive explorations in the wilderness of the South American jungles, the great German naturalist and geographer Alexander von Humboldt noticed something that has since become a classic pattern in ecology. He observed that within a region, species richness increases with the explored area — but only up to a limit.
In other words, the more ground you survey, the more species you record at first, yet the gains slow down and eventually level off. This relationship holds for a wide variety of taxa, including angiosperm plants, birds, bats and freshwater fishes.
The Shape of the Curve
When species richness is plotted against area on an ordinary arithmetic scale, the relationship turns out to be a rectangular hyperbola — a curve that rises steeply at first and then flattens as area grows.
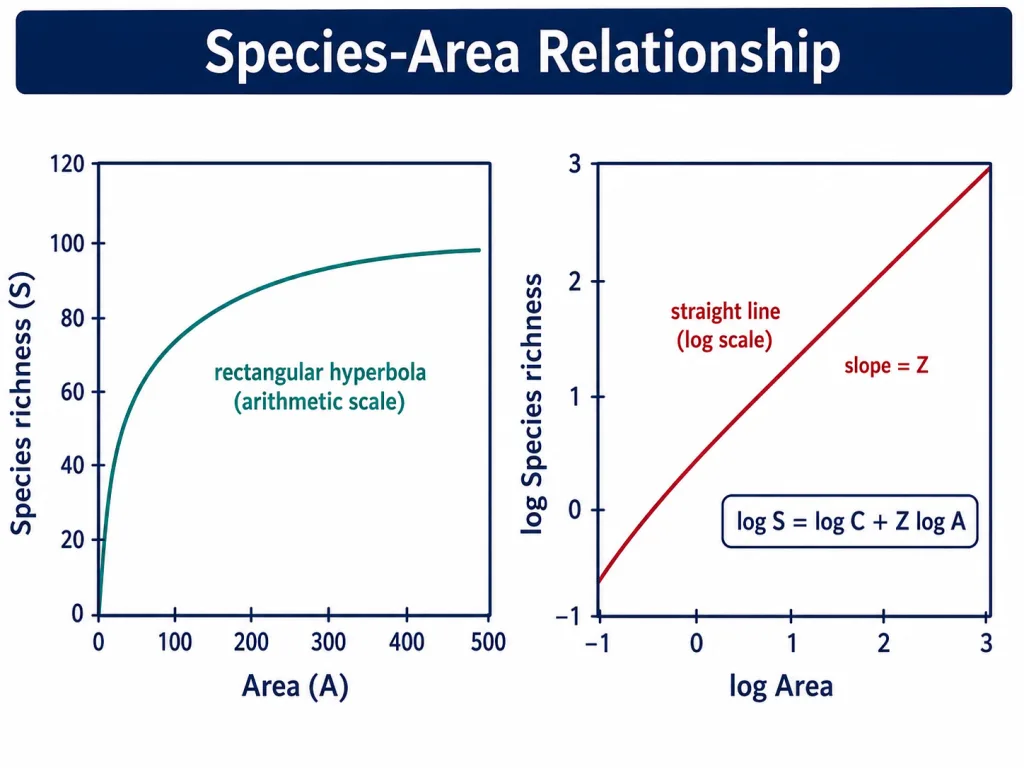
The hyperbola is a little awkward to work with, so ecologists redraw the same data on a logarithmic scale, where the curve straightens into a neat line. That straight line is described by the equation below.
The Species-Area Equation
On a logarithmic scale, the species-area relationship becomes linear and is written as:
where = species richness, = area, = slope of the line (regression coefficient), and = Y-intercept.
The most interesting quantity here is the slope . It tells us how fast species richness rises as area expands, and its value turns out to be remarkably consistent across very different groups and places.
What the Slope Tells Us
For relatively small areas, ecologists have found that the value of lies in the range of 0.1 to 0.2, and this holds regardless of the taxonomic group or the region. Whether you count the plants of Britain, the birds of California or the molluscs of New York state, the slopes of the regression line come out amazingly similar.
The picture changes when the areas studied become very large — the size of entire continents. Here the slope becomes much steeper, with values in the range of 0.6 to 1.2. For example, for frugivorous (fruit-eating) birds and mammals in the tropical forests of different continents, the slope is found to be about 1.15. A steeper slope means that, over continental scales, species richness climbs far more sharply with area than it does within a single region.
Quick Recap
- Alexander von Humboldt observed that within a region, species richness increases with area, but only up to a limit.
- On an arithmetic scale the species-area relationship is a rectangular hyperbola; on a logarithmic scale it becomes a straight line.
- The equation is , where = species richness, = area, = slope (regression coefficient), = Y-intercept.
- For small areas, lies between 0.1 and 0.2, independent of taxonomic group or region.
- For very large areas (whole continents), the slope is steeper, with between 0.6 and 1.2 (e.g. 1.15 for frugivorous birds and mammals in tropical forests).
Solved Examples — Section 4
Q1. Who first observed the species-area relationship, and what did he notice?
Answer: Alexander von Humboldt observed that within a region, species richness increases with the explored area, but only up to a limit.
Q2. What is the shape of the species-area relationship on an arithmetic scale?
Answer: A rectangular hyperbola.
Q3. Write the species-area equation and identify each term.
Answer: , where = species richness, = area, = slope (regression coefficient) and = Y-intercept.
Q4. What is the value of for small areas, and does it depend on the group studied?
Answer: For small areas lies between 0.1 and 0.2, and it is amazingly similar regardless of the taxonomic group or region.
Q5. How does the slope change for very large areas like continents?
Answer: The slope becomes much steeper, with values in the range of 0.6 to 1.2.
Q6. Give the slope value reported for frugivorous birds and mammals in tropical forests of different continents.
Answer: The slope is about 1.15.