
What a Population Has That an Individual Does Not
A population has certain attributes that no single individual possesses. An individual may be born or may die, but only a population has birth rates and death rates. In a population these are per-capita rates — they express the change in numbers relative to the members of the population.
A quick example makes this concrete. If a pond had 20 lotus plants last year and reproduction added 8 new plants (taking the total to 28), the birth rate is 8/20 = 0.4 offspring per lotus per year. If 4 individuals died in a laboratory population of 40 fruitflies in a week, the death rate is 4/40 = 0.1 individuals per fruitfly per week.
Sex Ratio
Another attribute of a population is its sex ratio. An individual is simply either male or female, but a population as a whole has a ratio between the sexes — for instance, 60 per cent of the population may be females and 40 per cent males.
Like birth and death rates, this is a property that only makes sense at the level of the group, not the individual.
Age Distribution and Age Pyramids
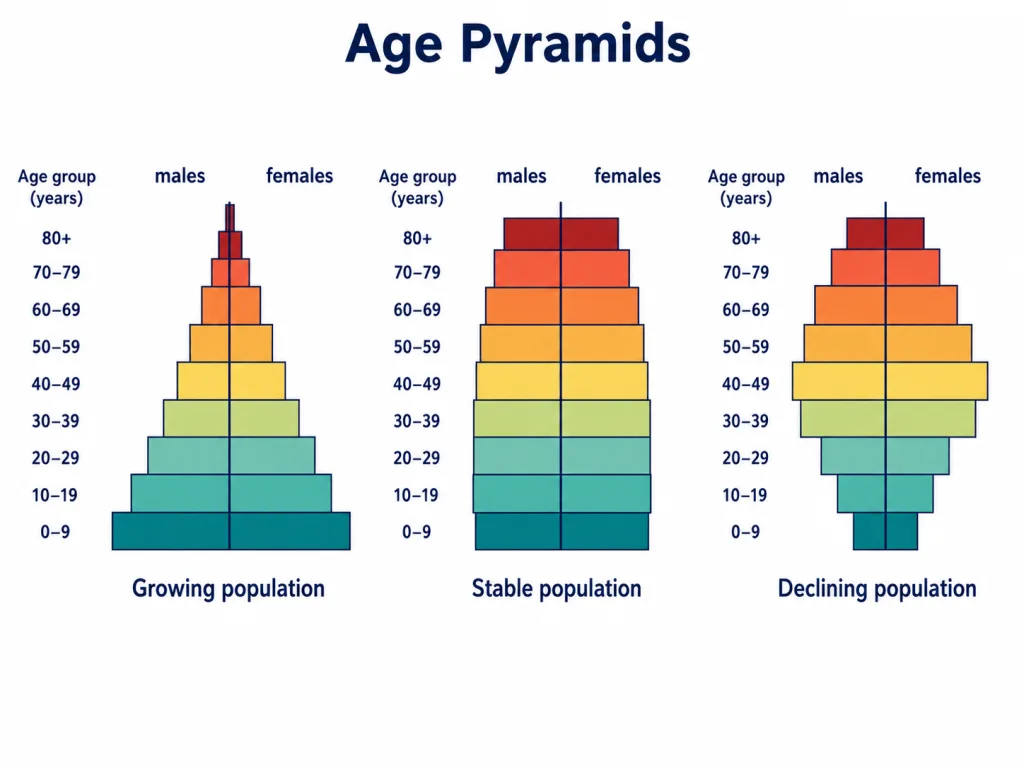
At any given time a population is made up of individuals of different ages. If the age distribution — the percentage of individuals in each age group — is plotted, the resulting structure is an age pyramid. For human populations the pyramid usually shows the distribution of males and females side by side.
The shape of the pyramid is revealing: it tells us the growth status of the population — whether it is growing, stable, or declining.
Reading the Pyramid
A triangular, broad-based pyramid, with many young individuals, is the signature of an expanding (growing) population — plenty of individuals are yet to reproduce. A bell-shaped pyramid, with roughly even proportions through the reproductive ages, is characteristic of a stable population, where births and deaths broadly balance. And an urn-shaped pyramid that narrows at the base points to a declining population, with fewer young individuals coming through.
Because the shape captures the balance of ages so compactly, the age pyramid is one of the most useful single pictures an ecologist can draw of a population's future.
Quick Recap
- A population has attributes an individual lacks: birth rates, death rates, sex ratio and age distribution.
- Birth and death rates are per-capita rates (e.g. 8 new plants among 20 lotus = birth rate 0.4 per lotus per year).
- Sex ratio is the proportion of males to females in the population.
- Age distribution plotted gives an age pyramid; its shape shows whether the population is growing (broad base), stable, or declining (narrow base).
Solved Examples — Section 2
Q1. Name the attributes a population has but an individual does not.
Answer: Birth rates and death rates, sex ratio, and age distribution.
Q2. A pond has 20 lotus plants and 8 new plants are added by reproduction in a year. What is the birth rate?
Answer: Birth rate = 8/20 = 0.4 offspring per lotus per year.
Q3. In a population of 40 fruitflies, 4 die in a week. What is the death rate?
Answer: Death rate = 4/40 = 0.1 individuals per fruitfly per week.
Q4. Why are population birth and death rates called per-capita rates?
Answer: Because they express the change in numbers relative to the members of the population, not just an absolute count.
Q5. What is an age pyramid?
Answer: A plot of the age distribution (percentage of individuals in each age group) of a population, often showing males and females separately.
Q6. What does a broad-based age pyramid indicate?
Answer: A growing population, because it has a large proportion of young, pre-reproductive individuals.