
The Apparatus: One Tube, Four Discoveries
Let's build the definitive photoelectric experiment (NCERT Fig. 11.1). The parts:
- An evacuated glass/quartz tube containing a thin photosensitive plate C (emitter) and a metal plate A (collector).
- Monochromatic light from source S enters through a quartz window W (quartz, because ordinary glass blocks ultraviolet) and falls on C.
- A battery maintains a variable potential difference between C and A, measured by a voltmeter; a commutator lets the polarity be reversed, so A can be positive or negative relative to C.
- The photocurrent is read on a microammeter — photoelectric currents are tiny.
When A is positive, emitted electrons are attracted to it and a current flows. Now we systematically vary, one at a time: (a) the intensity, (b) the frequency of the light, (c) the potential difference V, and (d) the emitter material — and watch the current.
Light of different frequencies is obtained with coloured filters; intensity is varied by changing the source-emitter distance.
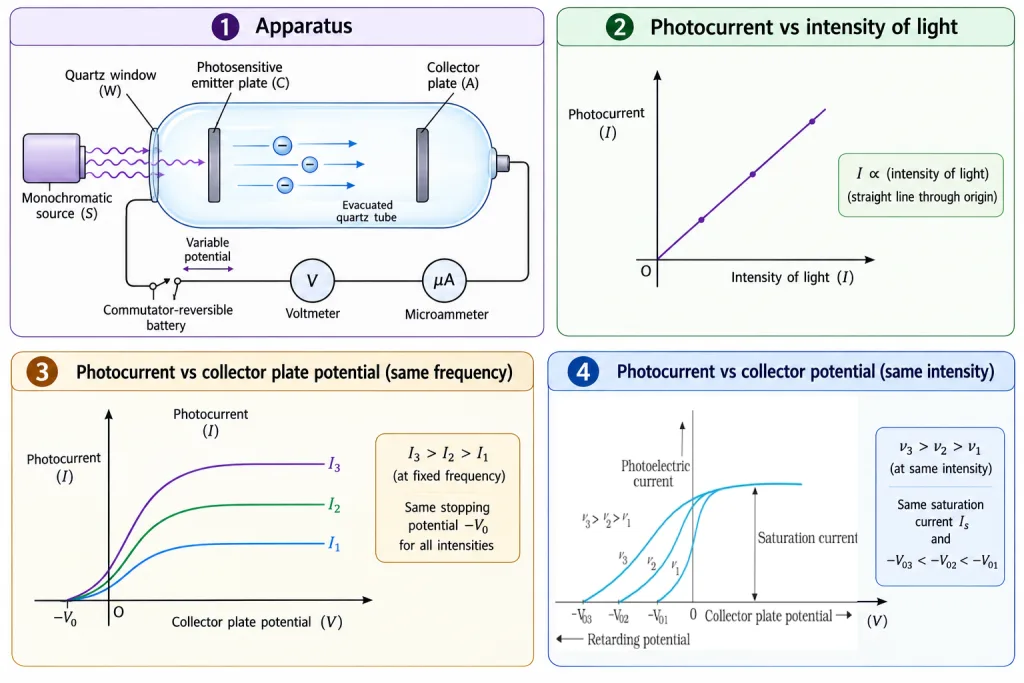
Result 1: Photocurrent vs Intensity — A Straight Line
Keep the frequency and accelerating potential fixed; vary the intensity. The result (NCERT Fig. 11.2) could not be simpler:
The photocurrent increases linearly with the intensity of incident light.
Since the photocurrent is directly proportional to the number of photoelectrons emitted per second, this means the emission rate is proportional to the intensity. Brighter light → proportionally more electrons per second. (No surprises yet — even the wave theory could live with this one.)
Result 2: The Effect of Potential — Saturation and Stopping
Fix the frequency and intensity (). Now vary the collector potential:
Accelerating (positive) potentials
Increasing positive potential on A collects more and more of the emitted electrons — the current rises, then saturates: beyond a certain potential, all emitted electrons are already being collected, so further increase does nothing. This maximum is the saturation current.
Retarding (negative) potentials
Reverse the polarity. Now A repels the electrons; only those with enough kinetic energy get through. As the retarding potential grows, the current falls rapidly, reaching zero at a sharply defined critical value — the cut-off or stopping potential.
The interpretation is beautiful: photoelectrons emerge with a range of kinetic energies. The stopping potential is what's needed to turn back even the fastest ones:
Now repeat with higher intensity
With intensities at the same frequency (NCERT Fig. 11.3): the saturation currents rise in proportion (more electrons per second), but the stopping potential does not budge.
Key Point: For a given frequency, the stopping potential — and hence — is completely independent of intensity. Brighter light ejects more electrons, not faster ones.
[JEE Tip] Graph-reading question, guaranteed: same frequency, different intensities → curves saturate at different heights but converge to the same on the negative axis. Different frequencies, same intensity → same saturation height, different . Learn to sketch both from memory.
Result 3: The Effect of Frequency — The Line That Changed Physics
Now fix the intensity, and take readings at several frequencies (NCERT Fig. 11.4). The photocurrent-vs-potential curves show:
- the same saturation current (same intensity → same emission rate), but
- different stopping potentials, ordered .
Higher frequency → more energetic photoelectrons → larger stopping potential needed.
Plot the stopping potential against frequency for a given metal (NCERT Fig. 11.5) and you get a straight line, showing:
- varies linearly with for a given photosensitive material.
- There is a minimum cut-off frequency — the threshold frequency — at which ; below it, no emission at all, however intense the light. Different metals have different .
Result 4: No time lag
If , emission starts instantaneously — within s — even for the dimmest light.
The Four Laws of Photoelectric Emission (Summary)
- For fixed frequency (above threshold), photocurrent ∝ intensity.
- Saturation current ∝ intensity, but the stopping potential is independent of intensity — depends only on frequency and material.
- Below the material-specific threshold frequency , no emission occurs regardless of intensity; above it, (equivalently ) increases linearly with frequency.
- Emission is instantaneous (~ s or less), even in dim light.
[NEET Important] Also from NCERT: different materials respond differently (selenium more sensitive than zinc or copper; copper responds to UV but not to green/red light). And note the phrasing 'sharply defined' for — the current drops to zero at a precise, not gradual, potential.
Solved Examples
Example 1: From stopping potential to maximum kinetic energy
The stopping potential in a photoelectric experiment is 1.5 V. Find of the photoelectrons in eV and joules.
Solution:
- Formula: .
- In eV: = 1.5 eV (immediate — that's the beauty of the unit).
- In joules: J.
- Takeaway: this is NCERT Exercise 11.3 in disguise — the eV answer requires zero computation.
Example 2: Maximum speed from stopping potential [Board Numerical]
In the same experiment ( = 1.5 V), find the maximum speed of the emitted photoelectrons.
Solution:
- Formula: .
- Rearrange: .
- Substitute: .
- Calculate: m/s.
- Takeaway: stopping potential in volts → speed in hundreds of km/s. Keep the mass in kg and energy in joules.
Example 3: Doubling the intensity [NEET Conceptual]
Light of fixed frequency causes a saturation current of 4 A with stopping potential 0.8 V. The intensity is doubled. Find the new saturation current and stopping potential.
Solution:
- Saturation current ∝ intensity: new saturation current = 8 A.
- Stopping potential is independent of intensity: stays 0.8 V.
- Takeaway: intensity controls how many, frequency controls how fast. This single distinction answers a huge fraction of MCQs.
Example 4: Reading the I-V family [JEE Graph]
Three I-V curves at the same frequency saturate at 2 A, 4 A and 6 A. What is the ratio of the corresponding intensities, and how do their stopping potentials compare?
Solution:
- Saturation current ∝ intensity → intensities are in ratio 1 : 2 : 3.
- Same frequency → identical stopping potential for all three curves; they meet at one point on the negative-V axis.
- Takeaway: converging-at- is the fingerprint of same-frequency curves.
Example 5: Ordering stopping potentials [NEET Pattern]
Light of frequencies Hz, Hz and Hz (same intensity) illuminates one metal. Order the stopping potentials and saturation currents.
Solution:
- Stopping potential rises with frequency: .
- Saturation current depends on intensity (photon arrival rate), which is the same → all three saturation currents are (approximately) equal, exactly as NCERT Fig. 11.4 shows.
- Takeaway: frequency moves the left edge (); intensity moves the flat top (saturation).
Example 6: The sharply defined cut-off
Why does the photocurrent drop to zero at a sharply defined potential rather than tapering off gradually forever?
Solution:
- Emitted photoelectrons have kinetic energies from 0 up to a definite maximum .
- A retarding potential V blocks all electrons with ; as V grows, fewer get through.
- Once , even the most energetic electrons are turned back — the current is exactly zero and stays zero.
- The sharp cut-off therefore proves a definite maximum kinetic energy exists — a crucial experimental fact Einstein's equation must (and does) explain.
Example 7: Intensity via distance [JEE Numerical]
In the NCERT set-up, intensity is varied by changing the source-emitter distance. If the distance is halved, what happens to the saturation current?
Solution:
- Inverse square law: intensity ∝ ; halving r quadruples the intensity.
- Saturation current ∝ intensity → the saturation current becomes 4 times larger.
- Stopping potential: unchanged (frequency untouched).
- Takeaway: distance-halving problems marry the inverse-square law to photoelectric proportionality — a classic hybrid.
Example 8: What the microammeter says at zero potential
Even with zero potential difference between C and A, a small photocurrent flows. Why?
Solution:
- Photoelectrons leave the emitter with kinetic energy up to .
- Some, ejected toward the collector, reach it under their own steam — no accelerating field needed.
- Hence a nonzero current at V = 0; the accelerating potential only helps collect electrons already emitted. This is why the I-V curve passes through a positive value at V = 0.
Example 9: Which changes what? [NEET Rapid Fire]
State the effect on (i) saturation current and (ii) stopping potential when: (a) intensity is increased at fixed frequency; (b) frequency is increased at fixed intensity; (c) the emitter metal is replaced by one with larger work function (same light).
Solution:
- (a) saturation current increases; stopping potential unchanged.
- (b) saturation current unchanged; stopping potential increases.
- (c) stopping potential decreases (larger eats more of the photon energy — using next section's equation), and if rises above , emission stops entirely; saturation current falls to zero in that case.
- Takeaway: the two dials (intensity, frequency) move two different needles — never both.
Example 10: Time lag test [Board Conceptual]
Extremely dim light above threshold falls on the emitter. Estimate how long emission takes to begin, and state the significance.
Solution:
- Experiment: emission begins within ~ s — effectively instantaneous.
- This holds however dim the light is; dimness reduces the number of electrons, never delays the start.
- Significance: the wave theory predicts hours of energy-accumulation delay for dim light (next section); the observed instantaneity is one of its fatal wounds.