
Mean of a List of Values
The mean (the arithmetic mean, or simply the average) of a list is the sum of the values divided by the number of values.
Here (read “sigma ”) stands for the sum of all the values and for how many there are. The mean is what each value would be if the total were shared out equally.
For example: eight students scored 34, 41, 28, 45, 37, 30, 42 and 39 marks out of 50 in a test. The sum is 296, so the mean is marks.
Turn it round: sum = mean number of values. Every question below about adding, removing or correcting a value uses it. If the mean of 12 numbers is 15.5, their sum is . If you are told the mean of the eight marks above is 37, the total 296 follows at once, and a missing mark can be found from it.
Adding with a working mean. When the values are close together, pick a round number near the middle, add only the differences from it, and share that out. With 40 as the working mean, the differences of the eight marks are , which add to . So
The same idea, used on a frequency table, is the assumed-mean method further down this page.
A zero is still a value. A batsman who scores 0 in an innings has played that innings. The zero adds nothing to the sum, but it counts in . A student who was absent is left out; a student who scored 0 is counted.
Where the mean lies. The mean is always between the smallest and the largest value, but it need not be one of the values: the mean of 3, 4 and 6 is . One very large or very small value pulls the mean towards itself. That is why the median is sometimes the better average for data such as incomes (see Median).
A Value Added, Removed or Replaced
Every question of this kind is the sum rule used twice: find the old sum, find the new sum and compare them. Chapter 5 has the word-problem versions with ages, salaries and runs; here are the bare statistics forms.
A value added. The mean of 14 values is 30. One more value is added and the mean becomes 31. Old sum: . New sum: . The new value is .
The fast way to see it: the new value has to be the new mean, 31, and also hand 1 extra to each of the 14 old values. So it is .
If the mean falls, the rise is negative and the value added is below the new mean.
A value removed. The mean of 25 values is 60. One value is taken out and the mean of the other 24 is 59. Old sum , new sum , so the value removed is . Fast way: the old mean plus 1 for each value left behind, .
A value replaced. The number of values stays the same, so the mean changes by . The mean of 16 values is 45 and the value 52 is replaced by 84. The sum goes up by 32, so the mean goes up by , to 47. Turned round: if replacing one value raises the mean of 20 values by 1.5, the new value is more than the old one.
Two parts that overlap. The mean of 11 values is 50, the mean of the first six is 49 and the mean of the last six is 52. The two parts together cover all 11 values and count the sixth one twice:
So the sixth value is 56.
Wrongly Copied Values and the Corrected Mean
A mean worked out with a wrong value is corrected through the sum. Fix the sum, then divide again.
One value misread. The mean of 30 values was found to be 42. Later it was noticed that the value 57 had been copied as 75. Wrong sum: . Correct sum: . Correct mean: .
The quick way: the sum was 18 too big, so the mean was too big, and the correct mean is .
Two values misread. Net the errors first. The mean of 40 values is 25, but 36 was taken as 63 and 18 was taken as 12. The first error added 27 too much and the second 6 too little, so the sum is 21 too big. The correct mean is .
A value wrongly included. The mean of 20 values is 18, but one of them, 37, should not have been counted at all. Now the number of values changes too:
A value left out. The mean of 24 values was worked out as 50, and a 25th value, 75, was missed. The correct mean is .
[SSC Tip] Before you calculate, decide which of two things happened. A misread value keeps the same and only the sum changes. An extra value or a missing value changes both the sum and , and dividing by the old is then a mistake.
Means of Natural, Even and Odd Numbers and of Arithmetic Lists
A list that goes up in equal steps (an arithmetic progression) has a mean that needs no adding:
The values pair off from the two ends, first with last, second with second last, and every pair has the same sum. So the mean is the average of the two ends. It is also the middle value of the list.
| List | Sum | Mean |
|---|---|---|
| First natural numbers | ||
| First even numbers | ||
| First odd numbers |
For example: the mean of the first 40 natural numbers is ; of the first 40 even numbers, 41; of the first 40 odd numbers, 40.
Find the two ends first. For the mean of all the multiples of 7 between 1 and 100, the first is 7 and the last is 98, so the mean is . The number of terms (14) is not needed. For all the two-digit numbers the ends are 10 and 99, and the mean is 54.5.
Consecutive numbers. For an odd count of consecutive numbers, the mean is the middle one. Five consecutive even numbers with mean 26 are 22, 24, 26, 28 and 30. For an even count, the mean falls halfway between the two middle numbers.
Working back to . If the mean of the first natural numbers is 15, then and .
Squares and cubes. These lists do not go up in equal steps, so the two-ends rule fails for them. The mean of the squares of the first natural numbers is ; for it is , not . The mean of the first cubes is .
Weighted Mean and the Combined Mean of Groups
When the values do not count equally, each value is multiplied by its weight:
For example: a shop buys 20 kg of rice at ₹ 40 a kg, 30 kg at ₹ 45 a kg and 50 kg at ₹ 52 a kg. The average price is not , because much more rice was bought at the highest price. Weighting each price by its kilograms:
So the average price is ₹ 47.50 a kg. A frequency table is the same idea, with the frequencies as the weights.
Combined mean of two groups.
Class A has 30 students with mean marks 64, and class B has 45 students with mean marks 54. Together:
The plain average of 64 and 54 is 59, but B has more students, so the combined mean sits nearer to B's 54.
Three groups work the same way: all the sums over all the counts. Groups of 20, 30 and 50 with means 50, 60 and 70 have a combined mean of .
Working back to the sizes of the groups. The combined mean divides the gap between the two group means in the inverse ratio of the group sizes:
For the two classes, , which is . The group whose mean is nearer to the combined mean is the bigger group.
[SSC Tip] A combined mean must lie between the group means and nearer to the larger group. An option outside that range, or on the wrong side of the plain average, can be crossed out before any working.
Mean of a Discrete Frequency Table
When values repeat, the data come as a frequency table: each value with its frequency , the number of times it occurs. A row stands for copies of the same value, so it adds to the sum.
For example: the goals scored by a team in 40 matches.
| Goals () | Matches () | |
|---|---|---|
| 0 | 5 | 0 |
| 1 | 10 | 10 |
| 2 | 12 | 24 |
| 3 | 8 | 24 |
| 4 | 3 | 12 |
| 5 | 2 | 10 |
| Total | 40 | 80 |
The mean is goals a match.
Wrong answers to avoid.
- Averaging the values 0 to 5 on their own gives . That treats every value as if it happened once.
- Dividing by the number of rows gives , more than 13 goals a match, which is bigger than every value in the table. A mean can never be outside the range of the values.
- Averaging the frequencies, , says nothing about goals at all.
Check the total of first. is the number of observations, here the matches. A question may state it (“in 40 matches”); if your column does not add up to it, you have misread a number.
Rows with add nothing to , but their frequency still counts in . The 5 goalless matches are part of the 40.
A working mean on a table. With 2 as the working mean, the deviations are , and
so the mean is exactly 2. This is the assumed-mean method, used on a small table.
Grouped Data: Class Marks and the Direct Method
In grouped data the exact values inside a class are lost. All the table tells you is that, say, 15 workers earn between ₹ 300 and ₹ 350 a day. So each class is represented by its class mark, the middle of the class:
The class marks then play the part of , and the working is the same as for a discrete table. This is called the direct method.
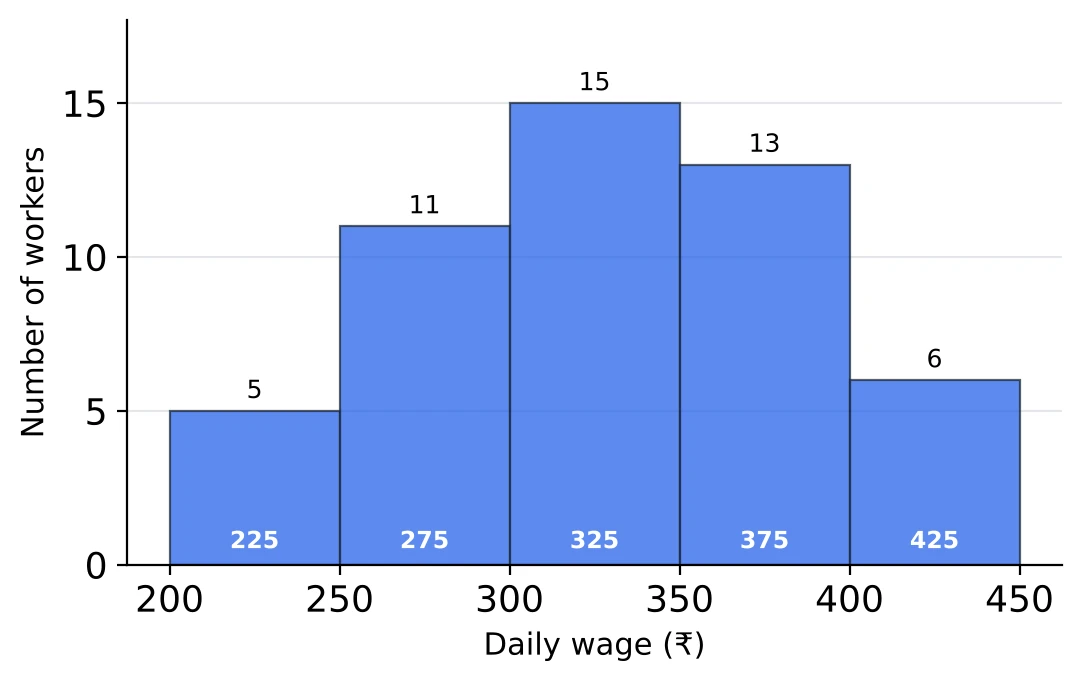
The daily wages of 50 workers, with the class mark written at the foot of each bar:
| Daily wage (₹) | Workers () | Class mark () | |
|---|---|---|---|
| 200-250 | 5 | 225 | 1125 |
| 250-300 | 11 | 275 | 3025 |
| 300-350 | 15 | 325 | 4875 |
| 350-400 | 13 | 375 | 4875 |
| 400-450 | 6 | 425 | 2550 |
| Total | 50 | 16450 |
The mean daily wage is ₹ 329.
Class marks without frequencies. The plain average of the five class marks is 325. It ignores how many workers are in each class. It happens to be close here because this table is nearly balanced; for a lopsided table it can be far off.
Inclusive classes. For classes written as 10-19, 20-29, 30-39, the class mark is still the average of the two written limits: and . Making the classes continuous (9.5-19.5, 19.5-29.5) gives the same middles, so for the mean you do not need the boundaries. The median and the mode do need them (see Median).
The answer is an estimate. Each class has been replaced by its middle value, so the mean of grouped data is an estimate of the true mean of the workers' wages. The assumed-mean and step-deviation methods below give exactly the same estimate with less arithmetic.
The Assumed-Mean Method
With large class marks, every is a big multiplication. The assumed-mean method works with small deviations instead. Choose a class mark near the middle of the table (usually the one with the highest frequency), write for each class, and use
The marks of 50 students, with :
| Marks | ||||
|---|---|---|---|---|
| 10-20 | 3 | 15 | ||
| 20-30 | 6 | 25 | ||
| 30-40 | 12 | 35 | ||
| 40-50 | 16 | 45 | 0 | 0 |
| 50-60 | 8 | 55 | 10 | 80 |
| 60-70 | 5 | 65 | 20 | 100 |
| Total | 50 |
Why it works. Every value is plus its deviation, so the mean is plus the mean of the deviations. The choice of does not change the answer. Try : the deviations become , the products add up to
and again. A class mark near the middle only keeps the numbers smaller.
Signs. Classes below give negative and classes above give positive . Add the negatives and the positives separately ( and here) and then combine them; this keeps the signs straight.
A rough check. The mean came out 3 below , and the table does have more students below the 40-50 class (21 of them) than above it (13). When is negative the mean is below ; when it is positive the mean is above .
The Step-Deviation Method
When all the classes have the same width , every deviation is a multiple of . Dividing by leaves very small numbers:
It is the quickest of the three methods, and the one to use in the exam whenever the class marks are large.
The monthly electricity bills of 50 houses, with and :
| Bill (₹) | ||||
|---|---|---|---|---|
| 400-600 | 4 | 500 | ||
| 600-800 | 10 | 700 | ||
| 800-1000 | 15 | 900 | ||
| 1000-1200 | 12 | 1100 | 0 | 0 |
| 1200-1400 | 6 | 1300 | 1 | 6 |
| 1400-1600 | 3 | 1500 | 2 | 6 |
| Total | 50 |
The mean bill is ₹ 960. By the direct method the same table needs products like and , and a total of 48,000, before the division.
The column writes itself. It is just counted out from the class you chose, so you can write it without working out a single class mark.
Multiplying back by . Do not stop at . Here it is , which is measured in class widths, so it must be multiplied by 200 before it is added to . An answer of is wrong, and the fact that it hardly differs from is the giveaway.
Unequal widths. If one class is wider than the others, is not a whole number for it. Use the assumed-mean or the direct method for such a table.
[SSC Tip] In the exam, write only the and columns next to the question. For a table of five or six classes the whole working fits in two lines.
A Missing Frequency from a Given Mean
Some questions give the mean and hide one or two frequencies. Write the unknown frequency as a letter, build and (or ) with it, and set the mean formula equal to the mean you were given.
One unknown, discrete table. The mean of this table is 31. Find .
| 10 | 20 | 30 | 40 | 50 | |
|---|---|---|---|---|---|
| 5 | 8 | 12 | 5 |
and . So
A shorter route takes deviations from 30, the value whose frequency is missing. Then , and the mean is . For a mean of 31 the fraction must be 1, so and . Because the unknown sits in the row with deviation 0, it turns up only once.
Two unknowns, grouped table, total given. The 50 observations below have mean 34.4. Find and .
| Class | 10-20 | 20-30 | 30-40 | 40-50 | 50-60 |
|---|---|---|---|---|---|
| 6 | 15 | 4 |
The total gives one equation: , so . For the other, take and . Then and , so
With , this gives and .
Put the answer back. A pair with the two values swapped, and , fits the total but not the mean. Ten seconds spent putting your frequencies back into the table settles which pair is right.
Changing Every Value, and the Sum of Deviations
When the same change is made to every value, the mean changes in the same way.
| Change made to every value | New mean |
|---|---|
| Add | |
| Subtract | |
| Multiply by | |
| Divide by () | |
| Replace by |
The values 12, 15, 18, 21, 24 have mean 18. Add 5 to each and the mean is 23; multiply each by 3 and it is 54; replace each by and it is . The new list is never needed.
Working backwards. Each value is reduced by 6 and then halved, and the new mean is 9. The old mean satisfies , so . Undo the steps in reverse order: double, then add 6.
Changing units. The rule is an change, so a mean temperature of is . A mean height of 1.6 m is 160 cm.
Deviations from the mean add up to zero.
The eight marks at the start of this page had mean 37. Their deviations are , and these add up to 0: the values above the mean exactly balance the ones below it. So if the deviations of five values from their mean are , then .
Deviations from some other number. About any number ,
If the deviations of 8 values from 50 add up to , then and . This is the working-mean idea once more.
Adding a constant moves the median and the mode by the same amount as the mean, but it leaves the standard deviation unchanged (see Range, Variance and Standard Deviation).
Solved Examples
Question 1
The runs scored by a batsman in eight innings were 38, 71, 12, 66, 0, 49, 85 and 57. What is his mean score per innings? (a) 47.25 (b) 54 (c) 53 (d) 47
Answer. I add all eight scores: . He batted eight times and the 0 is one of those innings, so I divide by 8: . The answer is (a) 47.25. If I had left out the duck and divided by 7, I would have got 54, which is wrong because that innings was played.
Question 2
The mean of 11 results is 30. The mean of the first six results is 28 and the mean of the last six is 33. What is the sixth result? (a) 30 (b) 31 (c) 36 (d) 26
Answer. The first six add up to and the last six to . Together that is 366, but all 11 results add up to only . The extra 36 is there because the sixth result is counted in both groups. So the sixth result is (c) 36.
Question 3
The mean of 24 observations is 40. When one more observation is included, the mean becomes 41. What is the new observation? (a) 41 (b) 65 (c) 64 (d) 66
Answer. Old sum: . New sum: . The new observation is the difference, 65.
The short way: the new value has to be 41 itself, plus 1 more for each of the 24 old values to lift their mean from 40 to 41. That is , so the answer is (b) 65.
Question 4
The mean of 30 observations is 52. If the observation 81 is removed, what is the mean of the remaining observations? (a) 49.3 (b) 50 (c) 53 (d) 51
Answer. The 30 observations add up to . Taking out 81 leaves , and now there are 29 observations, so the mean is (d) 51. I have to divide by 29 here, not 30, because one observation has gone.
Question 5
The mean of 50 observations was found to be 61. Later it was found that the observation 92 had been copied as 29. What is the correct mean? (a) 62.26 (b) 59.74 (c) 62.5 (d) 61.9
Answer. The wrong sum is . The 29 should have been 92, so the correct sum is , and the correct mean is .
Quicker: the sum was short by , so the mean was short by , and . The answer is (a) 62.26. The true value is bigger than the copied one, so the mean has to go up.
Question 6
The mean of 20 observations is 45. It was later found that two observations, 38 and 52, had been wrongly taken as 83 and 25. What is the correct mean? (a) 45.9 (b) 44.55 (c) 45 (d) 44.1
Answer. Wrong sum: . I take out the two wrong values and put in the right ones: . So the correct mean is , which is (d) 44.1. As a check, the wrong values added to 108 and the right ones to 90, so the sum was 18 too big and the mean too big.
Question 7
What is the mean of all the multiples of 6 between 20 and 200? (a) 110 (b) 102 (c) 111 (d) 105
Answer. The multiples of 6 go up in equal steps, so the mean is the average of the first and the last one. The first multiple of 6 after 20 is 24, and the last one before 200 is 198. So the mean is (c) 111, and I did not need to count how many multiples there are.
Question 8
The mean of five consecutive odd numbers is 37. What is the largest of them? (a) 39 (b) 45 (c) 43 (d) 41
Answer. For five consecutive odd numbers the mean is the middle one, so the middle number is 37. The numbers go up by 2, so they are 33, 35, 37, 39 and 41. The largest is (d) 41.
Question 9
The four papers of an examination carry weights 3, 2, 4 and 1. A candidate scores 72, 65, 80 and 58 marks in them. What is the weighted mean of the marks? (a) 68.75 (b) 72.4 (c) 72 (d) 70.6
Answer. I multiply each mark by its weight and add: . The weights add up to 10, so the weighted mean is , which is (b) 72.4. The plain average of the four marks would be 68.75, but that treats the paper with weight 1 like the one with weight 4.
Question 10
Section A of a class has 40 students whose mean mark is 62, and section B has 35 students whose mean mark is 68. What is the mean mark of all 75 students? (a) 64.8 (b) 65 (c) 65.2 (d) 64
Answer. Total marks of A: . Total marks of B: . All 75 students: , so the mean is (a) 64.8. A has more students, so the mean is pulled a little below 65, the plain average of 62 and 68.
Question 11
The mean salary of all the employees of an office is ₹ 24,000. The mean salary of the men is ₹ 26,000 and that of the women is ₹ 21,000. If there are 60 women, how many men are there? (a) 40 (b) 75 (c) 90 (d) 100
Answer. The overall mean is ₹ 2,000 below the men's mean and ₹ 3,000 above the women's. The sizes of the groups go the other way round, so men : women . With 60 women, the men are . The answer is (c) 90.
Check: . Mixing up the ratio and taking men : women as would give 40 men, but then the overall mean would be closer to the women's mean.
Question 12
Three classes have 30, 25 and 45 students, and their mean marks are 50, 60 and 48. What is the mean mark of all the students together? (a) 52 (b) 51.6 (c) 50.4 (d) 53
Answer. I find each class total: , and . Altogether marks for students, so the mean is (b) 51.6. It is below 52.67, the plain average of 50, 60 and 48, because the biggest class, with 45 students, has the lowest mean.
Question 13
The table shows the number of children in 50 families of a village.

What is the mean number of children per family? (a) 1.96 (b) 2.5 (c) 2.04 (d) 1.86
Answer. I multiply each number of children by its number of families: children in all. There are 50 families, so the mean is (a) 1.96. The 6 families with no children add nothing to the 98, but they still count among the 50.
Question 14
The marks of 50 students in a test out of 100 are shown below.

What is the mean mark? (a) 50 (b) 52.8 (c) 56.4 (d) 54.4
Answer. The class marks are 10, 30, 50, 70 and 90. I used step deviations with and , so :
The answer is (d) 54.4. If I just average the five class marks I get 50, but more students are in the upper classes, so the mean has to be above 50.
Question 15
The daily sales of a shop over 40 days are given below.
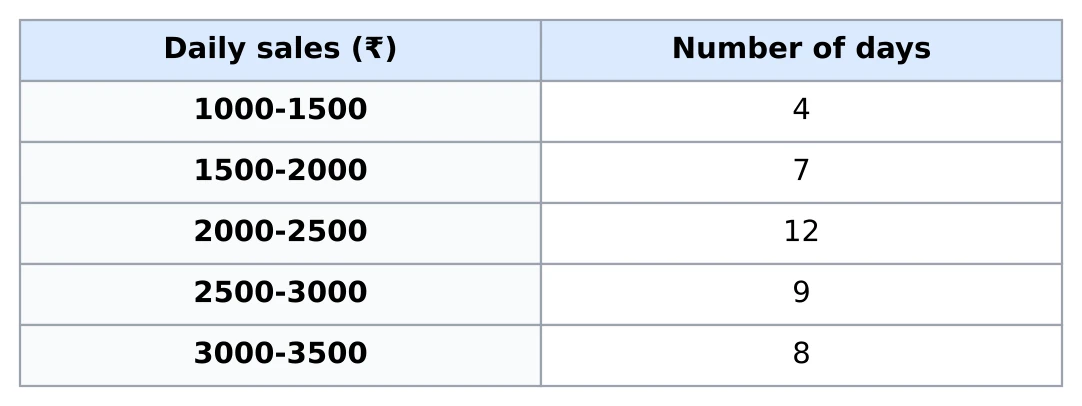
What is the mean daily sale? (a) ₹ 2,250.25 (b) ₹ 2,400 (c) ₹ 2,375 (d) ₹ 2,350
Answer. The classes are 500 wide, so I take (the middle of 2000-2500) and . Then and
So the mean daily sale is (c) ₹ 2,375. Without the final multiplication by 500 the answer would come out as 2250.25, almost the same as , which is how I know a step is missing.
Question 16
The ages of the 50 members of a club are given below.

What is the mean age of the members? (a) 43.4 years (b) 42.9 years (c) 44.5 years (d) 42.4 years
Answer. The class marks are the middles of the written limits: , then 34.5, 44.5, 54.5 and 64.5. With and , :
The answer is (b) 42.9 years. Taking the class marks as 25, 35, 45 and so on would push every one of them up by 0.5 and give 43.4.
Question 17
The mean of the following frequency distribution is 11.

What is the value of ? (a) 5 (b) 7 (c) 8 (d) 9
Answer. I write the totals with in them. and . The mean is 11, so
The answer is (b) 7. Putting it back: and , and .
Question 18
The mean of the following distribution is 24.

What is the missing frequency ? (a) 20 (b) 18 (c) 12 (d) 24
Answer. I take deviations from 25, the class mark of the class with , so that gets multiplied by 0. The other classes give . So the mean is , and this has to be 24. That means , so and is (d) 24.
Question 19
The table below has 40 observations in all, and their mean is 51.5.

What are the values of and ? (a) , (b) , (c) , (d) ,
Answer. First the total: , so .
For the mean I use (the middle class mark) and , so . Then , and
Adding and gives , so and . The answer is (a) , . I called the assumed mean here so that it would not get mixed up with the frequency .
Question 20
The mean of 15 observations is 24. Each observation is multiplied by 3 and then 5 is subtracted from it. What is the new mean? (a) 72 (b) 67 (c) 57 (d) 69
Answer. Whatever is done to every observation is done to the mean as well. So the new mean is (b) 67. The number of observations, 15, does not matter at all.
Question 21
The sum of the deviations of 10 observations from 25 is 40. What is the mean of the observations? (a) 29 (b) 65 (c) 4 (d) 21
Answer. The deviations add up to 40, so the observations themselves add up to . The mean is . In one step: the mean is 25 plus the average deviation, (a) 29.
Question 22
The deviations of six observations from their mean are and . What is ? (a) (b) 0 (c) 3 (d) 1
Answer. Deviations from the mean always add up to 0. The five known ones add up to , so has to be (c) 3 to bring the total back to 0.