
Median of a List
The median is the middle value of the data after the values have been arranged in order. Half the values lie at or below it and half at or above it.
Step 1: arrange. Write the values in ascending (or descending) order. If this step is skipped, the answer is wrong however careful the rest of the working is.
Step 2: find the middle position. For values:
- if is odd, the median is the th value;
- if is even, there are two middle values, the th and the th, and the median is their mean.
Odd count. The runs scored by a batsman in 9 innings were 34, 12, 56, 78, 45, 9, 61, 40 and 23. Arranged, they are 9, 12, 23, 34, 40, 45, 56, 61, 78. The middle position is , so the median is the 5th value, 40. The 5th value of the list as it was written is 45, and that is not the median.
Even count. Ten students scored 48, 35, 62, 51, 40, 57, 44, 66, 38 and 53. Arranged: 35, 38, 40, 44, 48, 51, 53, 57, 62, 66. The 5th and 6th values are 48 and 51, so the median is . With an even count the median need not be one of the values.
Repeated values stay in the list as many times as they occur. The median of 3, 5, 5, 5, 8, 9 is . Do not drop the repeats while arranging.
Extreme values hardly move it. If the 78 in the first list had been 780, the median would still be 40, while the mean would jump from about 39.8 to about 117.8. The median depends on the order of the values, not on how far out the end values are. That is why it is preferred for incomes, house prices and other data with a few very large values.
Unknowns in a List, and Adding or Removing Values
An unknown in an arranged list. The values 11, 14, 17, , , 26, 29, 33 are in ascending order and their median is 21. There are 8 values, so the median is the mean of the 4th and the 5th:
Check that the order still holds with : 17, 19, 23, 26. It does. If the value found broke the order, the list would have to be rearranged and the working done again.
When the order is not given. For the values with , arrange them first: . The median is , the middle one after arranging, not , the middle one as written. If this median is 9, then .
Adding values. Adding one value on each side of the median leaves it unchanged. The median of 4, 9, 13, 18, 21, 27, 30 is 18; add 2 and 35 and it is still 18. Adding two values on the same side moves the middle by one place. Add 6 and 11 instead, and the new list 4, 6, 9, 11, 13, 18, 21, 27, 30 has median 13.
Removing values works the other way. Remove the largest and the smallest and the median stays. Remove two values from the top and the middle moves one place down.
Arithmetic lists. For values in equal steps, the median equals the mean: both are the average of the first and last values. The median of the first natural numbers is ; for the first 60 it is 30.5, halfway between 30 and 31.
Count the values of a pattern list first. The odd numbers from 21 to 59 number . With 20 values the median is the mean of the 10th and 11th, 39 and 41, which is 40. That is the same as , as it should be for an arithmetic list.
Median of a Discrete Frequency Table
When values repeat, the data come as a table of values with frequencies . The idea is the same as for a list: arrange (the table usually is arranged already), find the middle position, and see which value sits there. Positions are found from the cumulative frequency , the running total of the frequencies.
The shoe sizes sold by a shop in one day:
| Size () | 5 | 6 | 7 | 8 | 9 | 10 |
|---|---|---|---|---|---|---|
| Pairs () | 4 | 9 | 15 | 11 | 7 | 3 |
| 4 | 13 | 28 | 39 | 46 | 49 |
is odd, so the median is the th value. The row says that sizes 5 and 6 cover the 1st to the 13th pairs, and size 7 covers the 14th to the 28th. The 25th pair is a size 7, so the median size is 7.
The rule: look along the row for the first entry that is equal to or greater than the middle position. The above it is the median.
Even . The number of books read in a month by 40 students:
| Books () | 1 | 2 | 3 | 4 | 5 |
|---|---|---|---|---|---|
| Students () | 6 | 10 | 4 | 12 | 8 |
| 6 | 16 | 20 | 32 | 40 |
The middle values are the 20th and the 21st. The 3s run from the 17th to the 20th, so the 20th value is 3, and the 21st is the first of the 4s. The median is . When both positions fall in the same row, the median is simply that .
Wrong answers to avoid.
- The middle of the table (7.5 for the shoes, 3 for the books) ignores the frequencies.
- The with the largest frequency (4 books) is the mode, a different average.
- The position (25th, or between the 20th and 21st) is not the median. It only tells you where to look.
Median of Grouped Data
In grouped data the exact values are lost, so the median is estimated. The steps:
- Write the cumulative frequencies and find .
- Work out .
- The median class is the first class whose is equal to or greater than .
- Use
where is the lower limit (boundary) of the median class, is the cumulative frequency of the class before the median class, is the frequency of the median class and is its width.
The marks of 100 students:
| Marks | 0-10 | 10-20 | 20-30 | 30-40 | 40-50 | 50-60 |
|---|---|---|---|---|---|---|
| Students () | 6 | 14 | 20 | 25 | 20 | 15 |
| 6 | 20 | 40 | 65 | 85 | 100 |
. The first to reach 50 is 65, so the median class is 30-40. Here , (the class before), and :
What the formula does. 40 students scored below 30. The 50th student is 10 places further on, inside the 30-40 class, whose 25 students are taken to be spread evenly over its width of 10. So the median is of the way through the class, 4 marks past 30.
, not . For grouped data the formula uses whether is odd or even. The rule belongs to lists and discrete tables.
Two mistakes to check for.
- Taking the of the median class itself (65) instead of the class before it (40). That gives , below the lower limit of its own class, which cannot happen.
- Leaving out , which gives .
A median found by the formula must lie inside the median class. If yours does not, one of these has gone wrong. If the classes differ in width, is the width of the median class.
[SSC Tip] You do not need the whole row. Add the frequencies from the left and stop as soon as the total passes : the class where you stop is the median class, and the total just before it is the for the formula.
Inclusive Classes, and Less-Than and More-Than Tables
Inclusive classes. Classes written as 20-29, 30-39, 40-49 leave gaps: a value of 29.6 belongs to none of them. The median formula needs continuous classes, so close the gaps first. The gap between 29 and 30 is 1. Take half of it, 0.5, away from every lower limit and add it to every upper limit: 20-29 becomes 19.5-29.5, 30-39 becomes 29.5-39.5, and so on.
The ages of 50 employees:
| Age (years) | 20-29 | 30-39 | 40-49 | 50-59 | 60-69 |
|---|---|---|---|---|---|
| Boundaries | 19.5-29.5 | 29.5-39.5 | 39.5-49.5 | 49.5-59.5 | 59.5-69.5 |
| 5 | 12 | 16 | 11 | 6 | |
| 5 | 17 | 33 | 44 | 50 |
, so the median class is 40-49, with (not 40), , and (not 9):
Using the written limit 40 would give 45, and using 9 as the width would give 44.
A less-than table. Here the table gives running totals instead of class frequencies (Chapter 18 reads such tables):
| Marks | Students |
|---|---|
| Less than 10 | 4 |
| Less than 20 | 11 |
| Less than 30 | 24 |
| Less than 40 | 39 |
| Less than 50 | 51 |
| Less than 60 | 60 |
These numbers are already the column. The classes are 0-10, 10-20, and so on up to 50-60, and each class frequency is a difference of neighbouring entries: 4, 7, 13, 15, 12, 9. ; the first entry to reach 30 is “less than 40: 39”, so the median class is 30-40, with and :
A more-than table counts from the top: “30 or more: 36” means 36 students scored at least 30. The same 60 students in this form read 60, 56, 49, 36, 21, 9 for “0 or more” up to “50 or more”. The class frequencies are again differences ( for 0-10, and so on), and the last class is the last entry, 9. Rebuild the ordinary row from these frequencies before using the formula. The more-than numbers themselves never go into the formula as .
A Missing Frequency from a Given Median
When the median is given and a frequency is missing, the median formula itself becomes the equation. The given median tells you the median class straight away, so , and are known; the unknown frequency turns up in , in the , or in both.
Two unknowns, total given. The median of the distribution below is 28 and the total frequency is 50. Find and .
| Class | 0-10 | 10-20 | 20-30 | 30-40 | 40-50 |
|---|---|---|---|---|---|
| 5 | 20 | 7 |
From the total, , so .
The median 28 lies in 20-30, so that is the median class: , , , and the before it is . With :
and then .
One unknown, total not given. Now contains the unknown, so does too. Suppose the classes 0-10 to 40-50 have frequencies 4, , 15, 9, 6 and the median is 24. The median class is 20-30, so , , , the before it is , and :
Check the median class. Put the value back and make sure really falls in the class you assumed. With , and the row begins 4, 18, 33, so does fall in 20-30, and the formula gives .
[SSC Tip] With two unknowns and the total given, the options are pairs that already add up to the right total. Only one pair puts the median where the question says, so testing the options in the formula is as quick as solving.
The Median from Ogives
An ogive is the graph of a cumulative frequency table. There are two kinds:
- the less than ogive joins the points (upper boundary, number less than it), starting at the first lower boundary with 0 and rising to ;
- the more than ogive joins the points (lower boundary, number at least that much), starting at and falling to 0 at the last upper boundary.
The figure shows both ogives for the daily travel time of 80 office workers, in the classes 10-20, 20-30, …, 60-70 minutes with frequencies 4, 10, 16, 20, 18 and 12.
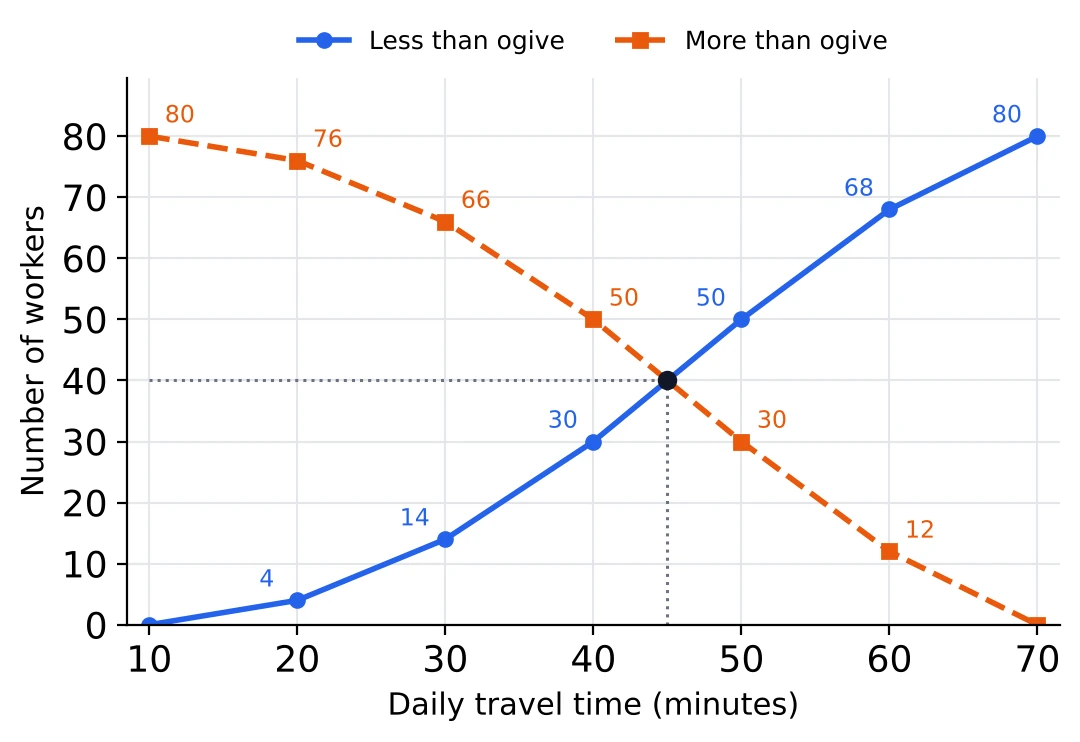
From one ogive. Mark on the vertical axis, go across to the less than ogive and drop down to the horizontal axis. The foot of that line is the median: 45 minutes.
From both ogives. The two curves cross at one point. Its horizontal coordinate is the median and its vertical coordinate is , because at the median exactly half the observations are below and half are above. Here the ogives cross at (45, 40).
So if you are told only that the two ogives of a distribution meet at (52.5, 36), the median is 52.5 and the total frequency is . Taking 36 as the median is the mistake to avoid.
Why the graph and the formula agree. Between the points (40, 30) and (50, 50) the less than ogive is a straight line, and a straight line is exactly the “spread evenly” assumption behind the formula:
The quartiles can be read off the less than ogive in the same way, going across from for the lower quartile and from for the upper one (see the quartiles at the end of these notes).
Changing Every Value: the Effect on the Median
Making the same change to every value does not alter their order (a negative multiplier reverses it exactly), so the middle value stays in the middle. The median goes through the same change.
| Change made to every value | New median |
|---|---|
| Add | |
| Subtract | |
| Multiply by | |
| Divide by () | |
| Replace by |
For the list 6, 10, 13, 17, 21 the median is 13. Adding 4 to each value gives median 17, and multiplying each by 3 gives 39. Replacing each by gives 38, 30, 24, 16, 8, whose median is . The order has flipped, but the middle value is still the middle one.
These are the same rules as for the mean (see Mean). So under such a change the gap between the mean and the median is multiplied by and is not affected by .
Changes that leave the median alone. Only the middle of the arranged list matters.
- Increasing the largest value, or decreasing the smallest, does not change the median. It does change the mean.
- Moving any value below the median to another place below it, or a value above it to another place above it, leaves the median where it is.
For example, 7 values have median 41 and mean 44. If the smallest value is reduced by 14, the median stays 41, but the mean falls by , to 42.
Combining two lists. Unlike the mean, the median of two lists put together cannot be found from their separate medians. The lists 1, 2, 3 (median 2) and 4, 10, 20 (median 10) together give 1, 2, 3, 4, 10, 20, whose median is 3.5, not 6, the average of the two medians. The values have to be merged and arranged again.
Quartiles and the Interquartile Range
The median cuts the arranged data into two halves. The quartiles cut it into four quarters:
- the lower quartile , with a quarter of the values below it;
- the median ;
- the upper quartile , with three quarters of the values below it.
For a list of values arranged in ascending order:
For example: 11 values arranged in order: 14, 17, 19, 22, 24, 27, 29, 32, 35, 38, 42. Here , so is the 3rd value, 19. is the 9th value, 35, and the median is the 6th value, 27.
Interquartile range . It measures the spread of the middle half of the data, and like the median it is not upset by one extreme value. Half of it, , is the quartile deviation (also called the semi-interquartile range).
When the position is not a whole number. For 9 values, , so is halfway between the 2nd and 3rd values, and , the 7.5th value, is halfway between the 7th and the 8th.
Grouped data. The median formula works for quartiles with or in place of . For the lower quartile:
using the class where the first reaches .
As with the median, arrange the list before counting positions. The 3rd value of an unsorted list is not a quartile of anything.
Solved Examples
Question 1
The weights (in kg) of 9 boys are 52, 47, 60, 55, 49, 58, 44, 63 and 51. What is the median weight? (a) 49 kg (b) 55 kg (c) 52 kg (d) 51 kg
Answer. First I arrange the weights: 44, 47, 49, 51, 52, 55, 58, 60, 63. There are 9 of them, so the th value, (c) 52 kg, is the median. The 5th weight in the list as given is 49, but that list was not in order.
Question 2
Find the median of 27, 19, 33, 24, 40, 30, 22, 36, 18, 29. (a) 28 (b) 27 (c) 35 (d) 29
Answer. Arranged: 18, 19, 22, 24, 27, 29, 30, 33, 36, 40. There are 10 numbers, an even count, so I need the 5th and the 6th, which are 27 and 29. The median is (a) 28.
Question 3
The observations 8, 11, 15, , , 24, 28, 31 are arranged in ascending order, and their median is 17. What is the value of ? (a) 17 (b) 16 (c) 15 (d) 18
Answer. There are 8 observations, so the median is the average of the 4th and 5th, which are and :
So the answer is (b) 16. I checked the order: 15, 16, 18, 24 still goes up, so the list really is arranged.
Question 4
For the data 3, 8, 10, 12, 15, 20, 30, by how much does the mean exceed the median? (a) 0 (b) 4 (c) 1 (d) 2
Answer. The data are already in order and there are 7 values, so the median is the 4th, 12. The sum is , so the mean is . The mean is more than the median by , which is (d) 2. The big value 30 pulls the mean up but does not move the median.
Question 5
The median of 6, 9, 13, 16, 20, 24, 27 is 16. If 10 and 15 are added to the data, what is the new median? (a) 15 (b) 16 (c) 14 (d) 13
Answer. Both new values are below 16, so the middle moves down. The new list in order is 6, 9, 10, 13, 15, 16, 20, 24, 27. There are 9 values, so the median is the 5th, (a) 15.
Question 6
What is the median of the numbers 3, 7, 11, 15, …, 83? (a) 41 (b) 45 (c) 43 (d) 40
Answer. The numbers go up by 4. First I count them: . With 21 numbers the median is the 11th, (c) 43. Shortcut: in a list with equal steps the median is the average of the ends, .
Question 7
The table shows the number of members in each of 35 families.

What is the median family size? (a) 5 (b) 4 (c) 18 (d) 4.5
Answer. is odd, so the median is the th value. I write the cumulative frequencies: 3, 11, 21, 27, 31, 33, 35. The 4-member families run from the 12th to the 21st, so the 18th family has (b) 4 members. The middle value of the top row, 5, is not the answer because it ignores how many families there are of each size.
Question 8
The table shows how many hours of television 40 children watch in a day.

What is the median? (a) 3.5 hours (b) 3 hours (c) 4 hours (d) 20.5 hours
Answer. is even, so I need the 20th and 21st values. Cumulative frequencies: 5, 14, 20, 32, 38, 40. The 3-hour children end exactly at the 20th, and the 21st is the first of the 4-hour group. So the median is hours, which is (a) 3.5 hours. Here the two middle values fall in different rows, so I could not just read one value off.
Question 9
The daily wages of 50 workers are shown below.
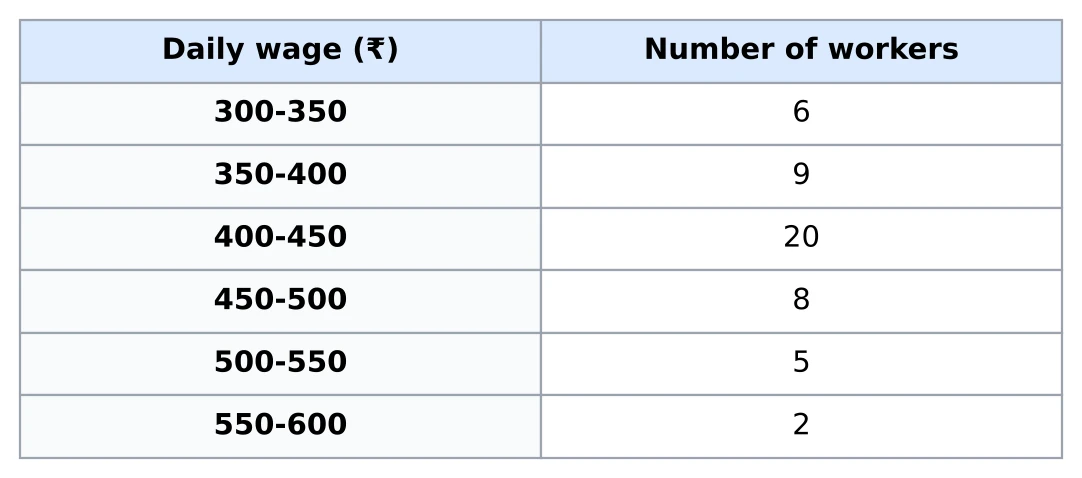
Which is the median class? (a) 350-400 (b) 450-500 (c) 300-350 (d) 400-450
Answer. . I add the frequencies from the top: 6, then 15, then 35. The total first goes past 25 at the class 400-450, so that is the median class, (d) 400-450. The class 350-400 brings the total only to 15, which is still short of 25.
Question 10
For the same data, what is the median wage? (a) ₹ 375 (b) ₹ 426.25 (c) ₹ 425 (d) ₹ 400.50
Answer. The median class is 400-450, so , and . The I need is the one before this class, which is 15:
The answer is (c) ₹ 425. If I had used 35, the of the median class itself, I would have got 375, which is not even inside 400-450.
Question 11
The marks of 50 students in an examination are given below.

What is the median mark? (a) 47 (b) 46.5 (c) 45.9 (d) 45.5
Answer. The classes have gaps (30 and 31, 40 and 41), so first I make them continuous by taking 0.5 off each lower limit and adding 0.5 to each upper limit. 41-50 becomes 40.5-50.5.
and the running totals are 2, 13, 33, so the median class is 40.5-50.5, with , and :
The answer is (b) 46.5. Using 41 as would have given 47.
Question 12
The table gives the marks of 72 students. No student scored less than 10.
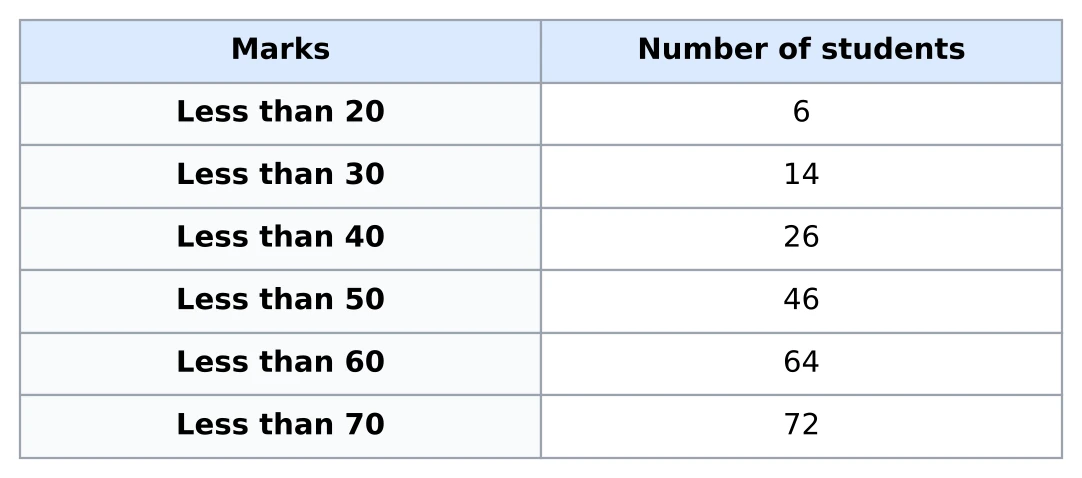
What is the median mark? (a) 45 (b) 50 (c) 46 (d) 40
Answer. The numbers are already cumulative, so the classes are 10-20, 20-30, …, 60-70. . The first entry to reach 36 is “less than 50: 46”, so the median class is 40-50. Its frequency is , and the before it is 26:
The answer is (a) 45. Answering 50 just because “less than 50” is the row where 36 is passed would skip the formula.
Question 13
The weights of 90 persons are given below. Nobody weighs 70 kg or more.
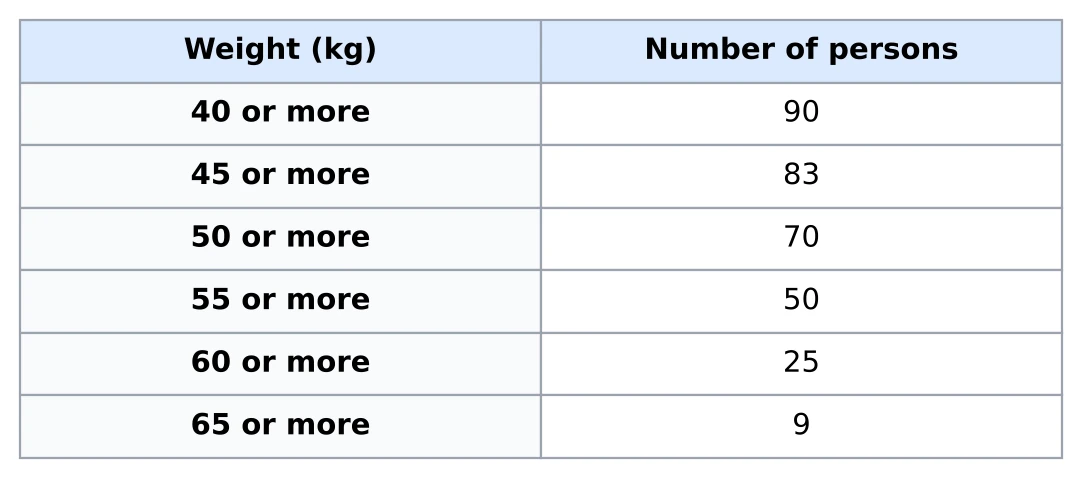
What is the median weight? (a) 55 kg (b) 57.5 kg (c) 56 kg (d) 58 kg
Answer. First I get the class frequencies by subtracting neighbours: 40-45 has , then 13, 20, 25, 16, and the last class 65-70 has 9. The ordinary running totals are 7, 20, 40, 65, …
, and 65 is the first total to reach 45, so the median class is 55-60, with , , :
The answer is (c) 56 kg.
Question 14
The median of the following distribution is 32.

What is the value of ? (a) 4 (b) 6 (c) 8 (d) 10
Answer. The median 32 is in 30-40, so that is the median class: , , . The total is , and the before 30-40 is . So
So and (b) 6. Check: , half is 23, and the running totals 6, 14, 20, 35 put the 23rd value in 30-40, with median .
Question 15
The distribution below has 60 observations in all, and its median is 46.

What are the values of and ? (a) , (b) , (c) , (d) ,
Answer. From the total, , so .
The median 46 lies in 40-60, so , , , and the before it is . With :
Then . The answer is (d) , .
Question 16
The less than and more than ogives of the ages of 120 people are drawn below. They meet at the point P.
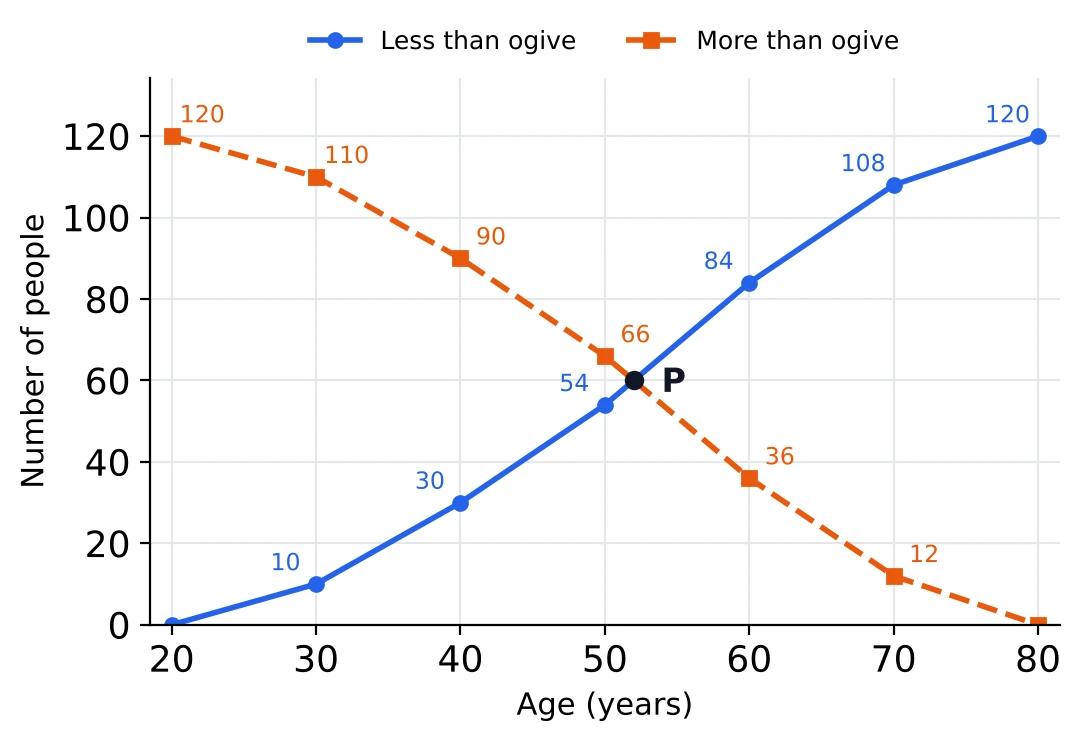
What is the median age? (a) 52 years (b) 60 years (c) 55 years (d) 50 years
Answer. The ogives meet at the median, and the height of P is . So the median is the age where the less than ogive reaches 60. From the graph, 54 people are under 50 and 84 are under 60, so the median class is 50-60 with :
The answer is (a) 52 years. The 60 is the height of P, a number of people, not an age.
Question 17
The less than ogive below shows the distance driven in a day by each of 60 taxis.
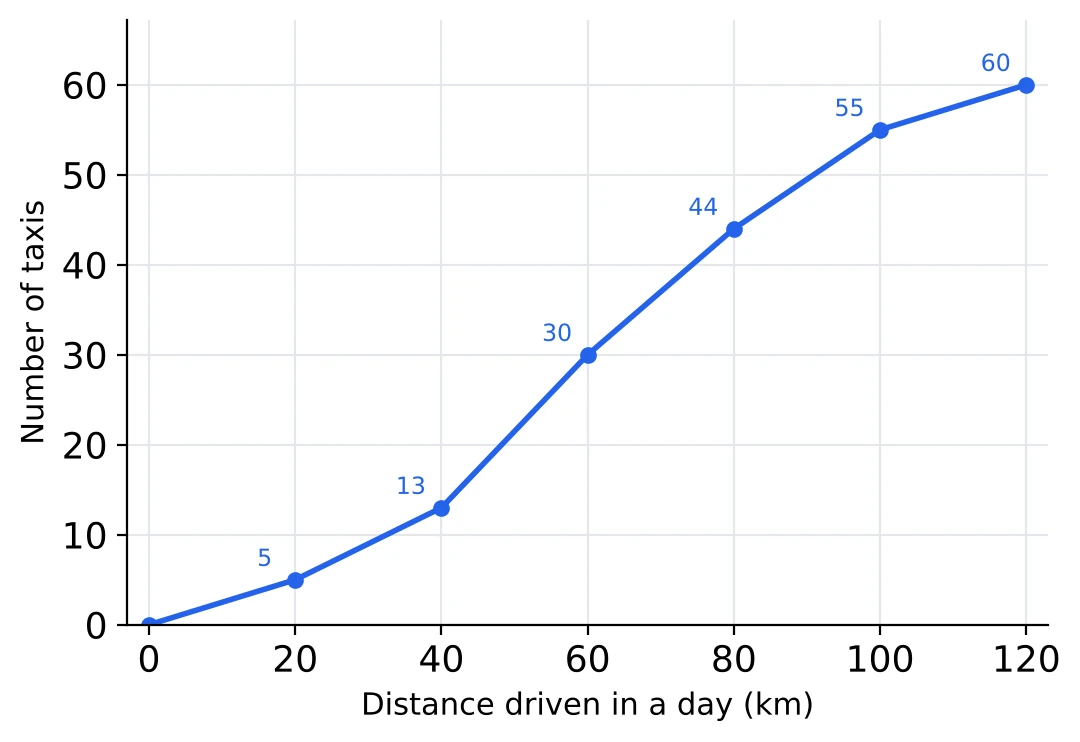
What is the median distance? (a) 30 km (b) 50 km (c) 60 km (d) 70 km
Answer. The last point of the ogive is 60, so and . I go across from 30 on the vertical axis to the curve. It meets the curve exactly at a plotted point, the one above 60 km, so the median is (c) 60 km. The formula agrees: the median class is 40-60 with and , and .
Question 18
The median of 11 observations is 18. Each observation is multiplied by 2 and then 3 is added to it. What is the new median? (a) 36 (b) 42 (c) 21 (d) 39
Answer. Doubling every value and adding 3 does not change their order, so the middle observation stays in the middle. It becomes , which is (d) 39.
Question 19
The mean and the median of 9 observations are 32 and 30. If the largest observation is increased by 18, what are the new mean and median? (a) Mean 32, median 32 (b) Mean 34, median 30 (c) Mean 34, median 32 (d) Mean 50, median 30
Answer. The sum goes up by 18, so the mean goes up by , to 34. The largest observation was already at the top and it stays at the top, so the 5th value in order is the same as before and the median stays 30. The answer is (b) Mean 34, median 30.
Question 20
Find the lower quartile and the upper quartile of 45, 32, 58, 27, 50, 39, 62, 35, 41, 55, 30. (a) , (b) , (c) , (d) ,
Answer. Arranged: 27, 30, 32, 35, 39, 41, 45, 50, 55, 58, 62. With , and , so the quartiles are the 3rd and 9th values, (c) , .
Question 21
For the data 21, 25, 28, 31, 34, 38, 42, 47, 53, find the interquartile range. (a) 18 (b) 17 (c) 9 (d) 32
Answer. The data are already in order and . is the th value, halfway between 25 and 28, so . is the 7.5th value, halfway between 42 and 47, so . The interquartile range is , which is (a) 18. Half of it, 9, would be the quartile deviation.