
Range and the Coefficient of Range
An average gives the centre of the data. It says nothing about how widely the values are spread. Two classes can both average 50 marks: in one, everybody scored between 45 and 55; in the other, the marks run from 10 to 90. Measures of spread (dispersion) describe this difference. The simplest of them is the range.
The marks of 7 students are 48, 36, 55, 64, 42, 51, 60. The largest is 64 and the smallest is 36, so the range is .
Pick the largest and the smallest from the whole list, not the first and the last values written. A score of 0 is a value like any other and can be the smallest.
Coefficient of range. The range has the same unit as the data, so the range of marks cannot be compared with the range of weights. Dividing by the sum of the two extremes gives a pure number:
For the marks: .
Range of grouped data. Take the upper limit of the last class minus the lower limit of the first class. For the classes 10-20, 20-30, up to 60-70, the range is .
An unknown value from the range. The range links the two extremes, so if one of them and the range are known, the other follows. If the largest value of a set is 75 and its range is 48, the smallest value is .
What the range misses. It uses only two values. One unusual value changes it a lot, and it says nothing about how the values in between are spread. The mean deviation and the standard deviation, below, use every value.
Mean Deviation
The mean deviation is the average distance of the values from a centre, either the mean or the median. The distances are taken without their signs; about the mean, the signed deviations would always add up to 0.
where is the mean or the median, and is the distance of from , always taken as positive.
The time (in minutes) taken by 7 students to solve a puzzle: 12, 5, 19, 10, 37, 4, 11.
The mean is . In order the times are 4, 5, 10, 11, 12, 19, 37, so the median is 11.
| 4 | 5 | 10 | 11 | 12 | 19 | 37 | Total | |
|---|---|---|---|---|---|---|---|---|
| Distance from the mean 14 | 10 | 9 | 4 | 3 | 2 | 5 | 23 | 56 |
| Distance from the median 11 | 7 | 6 | 1 | 0 | 1 | 8 | 26 | 49 |
The mean deviation about the median is never larger than the mean deviation about the mean, or about any other point. The median is the point from which the total distance to all the values is the least.
Coefficient of mean deviation , a pure number like the coefficient of range. For the puzzle times it is about the mean and about the median.
Two mistakes to avoid:
- Keeping the signs. The deviations from the mean, , add up to 0, and dividing 0 by 7 says nothing about the spread.
- Taking the median from the list as it is written. The middle of 12, 5, 19, 10, 37, 4, 11 as written is 10; the median of the arranged list is 11.
The mean deviation is easy to understand but awkward in algebra because of the signs dropped by hand. Squaring the deviations removes the signs in a cleaner way, and that leads to the standard deviation.
Variance and Standard Deviation
The standard deviation (SD), written , is the main measure of spread. It is built from the deviations from the mean, which are squared so that the signs disappear.
Two batsmen each scored 250 runs in 5 innings, so both have a mean of 50 runs:
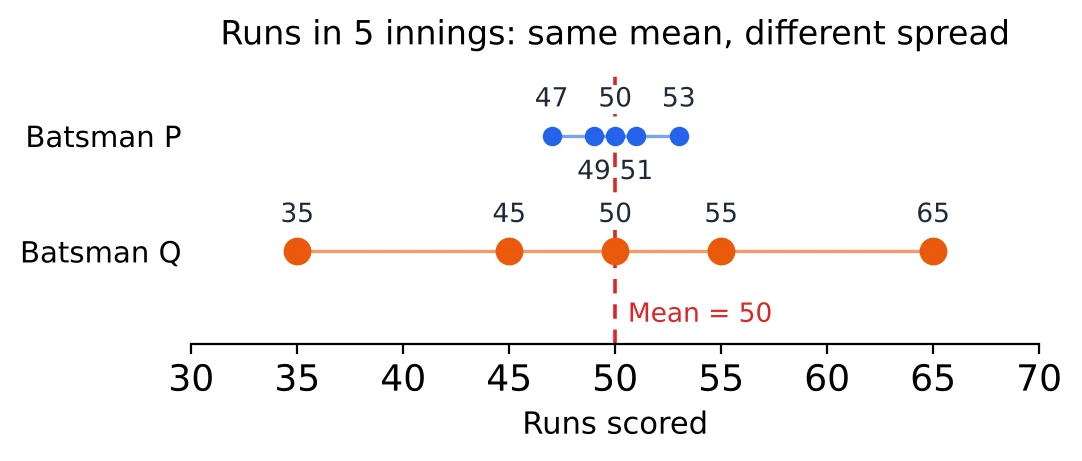
The averages are equal, but Q's scores are spread far wider. The SD shows this in one number. For Q:
| 35 | 45 | 50 | 55 | 65 | Total | |
|---|---|---|---|---|---|---|
| 0 | 5 | 15 | 0 | |||
| 225 | 25 | 0 | 25 | 225 | 500 |
Variance , so runs. For P the squared deviations are 9, 1, 0, 1 and 9, which add up to 20, so the variance is 4 and runs. P's smaller SD says his scores stay close to his average.
Points to keep straight:
- The deviations from the mean always add up to 0 (the total in the middle row). That is why they are squared before adding.
- The variance is in square units (); the SD is back in runs. When a question asks for one of them, do not give the other.
- is never negative. It is 0 only when all the values are equal.
- Divide by , the number of values; CGL and CHSL questions do this. Only when a question says 'sample variance' or 'sample standard deviation' (Selection Post papers have asked this) divide the sum of the squared deviations by instead. For 2, 4 and 6 the squared deviations add up to 8, so the variance is , but the sample variance is .
The Shortcut Formula
Squaring deviations is slow when the mean is not a whole number. Expanding the square gives a formula that needs only the values and their squares:
In words: the mean of the squares minus the square of the mean.
The numbers of books read in a month by 6 students are 1, 2, 4, 5, 7, 8.
- , so .
- .
With the first formula you would have squared , , and so on. Here only whole numbers are squared, and the decimal appears once, in .
Square the mean before subtracting. is not the variance of anything.
Working backwards. Turned round, the same formula gives the sum of the squares:
If 8 values have mean 6 and SD 2, then . This form is what you need when a question changes, adds or corrects a value and asks for the new SD: rebuild and , make the change in both, and use the formula again.
Since a variance cannot be negative, the mean of the squares is never smaller than the square of the mean. The two are equal only when every value is the same.
Variance of a Frequency Table
In a frequency table each value counts as many times as its frequency. With :
The marks (out of 25) of 25 students in a weekly test:
| Marks | Students | |||
|---|---|---|---|---|
| 5 | 3 | 15 | 300 | |
| 10 | 6 | 60 | 150 | |
| 15 | 7 | 105 | 0 | 0 |
| 20 | 6 | 120 | 5 | 150 |
| 25 | 3 | 75 | 10 | 300 |
| Total | 25 | 375 | 900 |
Two mistakes to avoid:
- Dividing by the number of rows (5) instead of the number of students, .
- Squaring the frequency along with the deviation. Each row is : here , not .
When the mean is not a whole number, add a column for and use , exactly as for a list.
Grouped data. Use the class marks as the values of and work in the same way. When the class marks are large, subtract a convenient mark and divide by the width first, ; find the SD of and multiply it by at the end. Subtracting does not change the spread, and dividing by is undone by the final multiplication (the reason is in the part on changing every value).
Variance of the First n Natural Numbers
For the numbers :
The variance follows from the shortcut formula, using :
| 5 | 7 | 10 | |
|---|---|---|---|
| Variance | 2 | 4 | 8.25 |
| SD | 2 |
For the SD is a whole number, . For most other values of the variance is the cleaner answer.
Any evenly spaced list. A list with terms is the list multiplied by and then shifted. Shifting does not change the spread, and multiplying by multiplies the variance by :
- The first even numbers, (): .
- The first odd numbers, : also , because this list is the even list moved down by 1.
- 5, 10, 15, 20, 25 (, ): and .
When a list of five or more evenly spaced numbers is given, spot the common difference and use this formula. It is much faster than squaring each deviation.
Changing Every Value
Questions often take a data set with a known SD and change every value in the same way. The rules:
| Change made to every value | Mean, median, mode | Range, mean deviation, SD | Variance |
|---|---|---|---|
| Add or subtract | Change by | No change | No change |
| Multiply by | Multiplied by | Multiplied by | Multiplied by |
| Divide by | Divided by | Divided by | Divided by |
Why adding changes nothing. Every value and the mean move by the same amount, so every deviation stays exactly what it was.
Why multiplying uses and . Every deviation is multiplied by . Squaring them multiplies the variance by , and the square root brings the SD back to times. A negative turns the data round, but the spread is just as wide, so the SD stays positive.
Both at once. If for every value, then
and plays no part.
For a class whose marks have an SD of 6:
- Every student gets 5 grace marks: the SD is still 6.
- Every mark is doubled: the SD becomes 12 and the variance becomes .
- Marks are changed to when the SD of is 4: , never .
[SSC Tip] Read whether the question wants the SD or the variance after the change. If every value is multiplied by 3, the SD becomes 3 times as large but the variance becomes 9 times as large, and an option with the variance multiplied by 3 is there for the reader who mixed the two up.
Quick Results for Small Sets
Two values. For two numbers and , the mean is halfway between them, and each number is half the gap away from it. So both deviations are , and
For 12 and 20: and the variance is 16. Working backwards, if two numbers have SD 5 and the smaller is 9, the larger is .
All values equal. The SD is 0, because every deviation is 0. The reverse is also true: an SD of 0 means every value is the same.
Three evenly spaced values. For , , the deviations are , 0 and :
For 7, 10, 13: , so and .
A limit that rules out options. The SD can never be more than half the range. For batsman Q earlier, the range is , half of it is 15, and is below it. An option bigger than half the range cannot be the SD.
Adding a value equal to the mean. It adds nothing to but increases , so the variance and the SD go down slightly. Removing such a value makes them go up slightly. The mean stays the same either way.
Coefficient of Variation and Consistency
The SD is in the units of the data, so it cannot compare groups with very different means, or data measured in different units. The coefficient of variation (CV) gives the SD as a percentage of the mean:
The lower the CV, the more consistent the data.
Two batsmen over a season:
| Batsman | Mean runs | SD | CV |
|---|---|---|---|
| A | 60 | 12 | |
| B | 30 | 9 |
A has the larger SD, but A is the more consistent batsman: 12 runs is a smaller part of A's average than 9 runs is of B's. Comparing the SDs alone would pick the wrong batsman.
When the means are equal, the CVs compare in the same order as the SDs, so the set with the smaller SD is the more consistent one. The two batsmen P and Q earlier had the same mean, and P, with the smaller SD, is more consistent.
Working backwards. If the CV is 25% and , then , so .
Raw data. If the two sets are given as lists, find the mean and the SD of each first, then the two CVs. Keep the CVs as fractions if they are not whole numbers; you only need to know which is smaller.
[SSC Tip] 'More consistent', 'more stable', 'more uniform' and 'less variable' all point to the smaller CV; 'more variable' points to the larger one. Decide which the question wants before comparing.
Solved Examples
Question 1
The heights (in cm) of 8 plants are 34, 41, 29, 46, 38, 52, 31, 44. What is the range of the heights? (a) 10 cm (b) 23 cm (c) 18 cm (d) 40.5 cm
Answer. I look for the largest and the smallest heights, not the first and the last ones written. The largest is 52 and the smallest is 29, so the range is (b) 23 cm.
Question 2
The weights (in kg) of 6 boxes are 18, 25, 12, 30, 22, 15. What is the coefficient of range? (a) (b) 18 (c) (d)
Answer. The largest is 30 and the smallest is 12. Coefficient of range , so the answer is (d) , about 0.43. The range by itself is 18 kg; the coefficient has no unit, because the kg cancels.
Question 3
The range of a set of numbers is 36, and the largest number is 3 times the smallest. What is the smallest number? (a) 18 (b) 12 (c) 9 (d) 54
Answer. Let the smallest be . Then the largest is , and the range is , so . The smallest number is (a) 18, and the largest is 54.
Question 4
The runs scored by a batsman in 7 innings are 25, 3, 31, 26, 15, 32, 29. What is the mean deviation about the mean? (a) 0 (b) 7 (c) 8 (d) 56
Answer. The total is 161, so the mean is . The distances from 23, ignoring signs, are 2, 20, 8, 3, 8, 9 and 6. They add up to 56, and . So the mean deviation is (c) 8. If I had kept the signs, the deviations would have added up to 0, which is why the signs are dropped.
Question 5
For the same innings, what is the mean deviation about the median? (a) 8 (b) 7 (c) 6 (d) 49
Answer. In order the scores are 3, 15, 25, 26, 29, 31, 32, so the median is 26. The distances from 26 are 23, 11, 1, 0, 3, 5 and 6, which add up to 49. Mean deviation (b) 7. It is smaller than the value about the mean, as it should be, because no point has a smaller total distance to the data than the median.
Question 6
What is the variance of 16, 19, 20, 22, 28? (a) 16 (b) 4 (c) 20 (d) 80
Answer. The mean is . The deviations are , which add up to 0, so the mean is right. Their squares are 25, 4, 1, 1 and 49, a total of 80. Variance (a) 16. The SD would be 4, but the question asks for the variance.
Question 7
What is the standard deviation of 12, 16, 19, 27? (a) 30.25 (b) 4.5 (c) 6.35 (d) 5.5
Answer. The mean is , not a whole number, so I use the squares. . Then
The SD is (d) 5.5.
Question 8
The mean and the standard deviation of 10 observations are 12 and 3. What is the sum of the squares of the observations? (a) 1440 (b) 1470 (c) 1530 (d) 153
Answer. From , I get . So and , which is (c) 1530. The thing to watch is to use here, not .
Question 9
The distance travelled in a day by each of 40 delivery riders is given below.
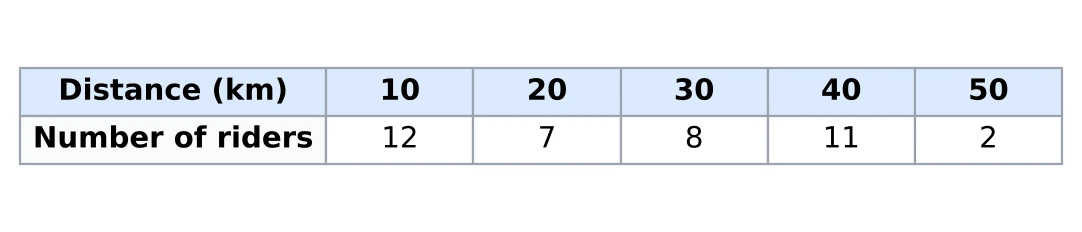
What is the standard deviation of the distance? (a) 169 km (b) 13 km (c) 12 km (d) 15 km
Answer. I made a table with the mean first: , so .
| 10 | 12 | 3072 | |
| 20 | 7 | 252 | |
| 30 | 8 | 4 | 128 |
| 40 | 11 | 14 | 2156 |
| 50 | 2 | 24 | 1152 |
| Total | 40 | 6760 |
Variance , so the SD is km, which is (b) 13 km. I divided by the 40 riders, not by the 5 rows.
Question 10
What is the coefficient of variation of the distance? (a) 50% (b) 200% (c) 13% (d) 650%
Answer. From the last question, the mean is 26 km and the SD is 13 km. CV , which is (a) 50%. The SD goes on top; with the fraction turned over, the CV would come out at 200%, which would mean the SD is twice the mean.
Question 11
What is the variance of the first 10 natural numbers? (a) 2.87 (b) 99 (c) 9.9 (d) 8.25
Answer. Variance . So it is (d) 8.25. I checked it with the shortcut: the mean of the squares is , the mean is 5.5, and .
Question 12
What is the standard deviation of 4, 8, 12, 16, 20, 24, 28? (a) 64 (b) 2 (c) 8 (d) 16
Answer. These are the numbers 1 to 7, each multiplied by 4. The variance of 1 to 7 is , so their SD is 2. Multiplying every value by 4 multiplies the SD by 4, so the SD here is 4 times 2, (c) 8.
Question 13
The variance of the ages of a group of 12 friends is 9. What will be the variance of their ages after 4 years? (a) 9 (b) 13 (c) 25 (d) 3
Answer. After 4 years every age goes up by 4, and so does the mean. Each friend's distance from the mean stays the same, so the spread does not change. The variance stays (a) 9.
Question 14
The standard deviation of a set of values is 4.5. If every value is multiplied by 4, what is the variance of the new values? (a) 18 (b) 324 (c) 81 (d) 72
Answer. The new SD is , so the new variance is , which is (b) 324. Another way: the old variance is , and multiplying the values by 4 multiplies the variance by , giving . The question wants the variance, so I had to square.
Question 15
The standard deviation of a variable is 5. If , what is the standard deviation of ? (a) (b) 8 (c) 225 (d) 15
Answer. The 7 is added to every value, so it does not change the spread. The multiplies every deviation by , so the SD is multiplied by . So (d) 15. An SD is never negative.
Question 16
What is the standard deviation of the two numbers 17 and 31? (a) 14 (b) 49 (c) 7 (d) 3.5
Answer. The mean is 24, and each number is 7 away from it. So the SD is , which is (c) 7. Its square, 49, is the variance.
Question 17
The mean of 5 observations is 7 and their variance is 6.8. Three of the observations are 3, 5 and 10. What are the other two? (a) 8 and 9 (b) 7 and 10 (c) 6 and 11 (d) 5 and 12
Answer. Let the other two be and .
- Sum: the 5 observations add up to , so .
- Squares: , so .
Then , so and . Two numbers with sum 17 and product 72 are 8 and 9. So the answer is (a) 8 and 9. Every option adds up to 17, so the sum alone could not decide it; the squares did.
Question 18
The mean and the standard deviation of 10 observations were found to be 10 and 4. Later it was found that one observation had been copied as 18 instead of 8. What is the correct standard deviation? (a) 4 (b) 3 (c) (d) 2
Answer. First the totals from the wrong data: and . Now I take out 18 and put in 8, in both totals: and . The correct mean is , and the correct variance is . So the correct SD is (b) 3. Both totals have to be corrected; fixing only the mean and keeping the old sum of squares goes wrong.
Question 19
The daily sales of a shop have a mean of ₹ 40 thousand and a standard deviation of ₹ 6 thousand. What is the coefficient of variation? (a) 6% (b) 24% (c) (d) 15%
Answer. Dividing the SD by the mean, gives a CV of (d) 15%. Both numbers are in ₹ thousand, so the unit cancels and the CV is a plain percentage.
Question 20
Over a season, cricketer A scored a mean of 48 runs with a standard deviation of 12, and cricketer B a mean of 36 runs with a standard deviation of 10. Which of them is more consistent? (a) B, since its standard deviation is lower (b) B, since its mean is lower (c) A, since its coefficient of variation is lower (d) Both are equally consistent
Answer. CV of A . CV of B . A's CV is lower, so A is more consistent: (c) A, since its coefficient of variation is lower. B's SD is smaller, but B's average is smaller too, so 10 runs is a bigger part of it.
Question 21
The daily output (in units) of two machines over 5 days was: Machine X: 14, 18, 20, 22, 26; Machine Y: 41, 47, 50, 53, 59. Which machine's output is more consistent? (a) Y, with a CV of 12% (b) X, with a CV of 20% (c) X, with an SD of 4 (d) Both are equally consistent
Answer. Machine X: mean 20, deviations , squares adding up to 80, variance 16, SD 4, so CV .
Machine Y: mean 50, deviations , squares adding up to 180, variance 36, SD 6, so CV .
Y has the larger SD but the smaller CV, so Y is more consistent: (a) Y, with a CV of 12%.