
How to Use These Questions
The 34 questions below run through the chapter in order: means of lists and of groups, means of frequency tables, medians of lists, grouped and cumulative tables, modes, the empirical relation, one table used for all three averages, and finally range, mean deviation, variance and standard deviation. Several tables carry two or three questions, and the later ones lean on the earlier answers.
Before using a formula, write down what each letter stands for in that question: , , and for a median, and , and for a mode. The formulas are short; the marks go when a wrong number is put into them. Give each question about a minute. Any that take you much longer, try again a day later with the quick route from Shortcuts & Speed Methods.
Solved Examples
Question 1
The mean of 12 numbers is 38. Each of the first 6 numbers is increased by 5, and each of the other 6 is decreased by 2. What is the new mean?
Answer. I looked only at the change in the total. Six numbers went up by 5, which adds 30, and six went down by 2, which takes away 12. So the total rose by 18, and the mean rose by . The new mean is 39.5.
Question 2
The mean of the squares of the first natural numbers is 63. Find .
Answer. The mean of is . Setting it equal to 63 gives . I tried numbers near the square root: gives . So .
Question 3
The mean of 20 numbers is 42. One number, 63, is removed, and two numbers, 35 and 49, are added. What is the mean of the new set of numbers?
Answer. The old total is . Taking out 63 and adding 35 and 49 makes it . There are now 21 numbers, so the mean is 41. Dividing by 20 here would be a mistake, because the count has changed.
Question 4
A class has three sections, A, B and C, with 30, 45 and 25 students. The mean marks of A and C are 60 and 70, and the mean marks of all 100 students together are 65.2. Find the mean marks of section B.
Answer. The total of all 100 students is . A has marks and C has . So B's 45 students have marks, and their mean is 66.
Question 5
In a company, the mean monthly salary of all the employees is ₹ 42,000. The 40 managers have a mean salary of ₹ 75,000 and the other employees a mean salary of ₹ 36,000. How many other employees are there?
Answer. I measured the gaps from the overall mean of 42 thousand: the managers are 33 above it and the others are 6 below it. The group sizes are in the opposite ratio of these gaps, so managers : others . With 40 managers, there are 220 other employees. Check: .
Question 6
A college gives weights 4, 3, 2 and 1 to Maths, Science, English and Hindi. A student scores 84, 76, 70 and 65 in them. Find the student's weighted mean score.
Answer. Each mark is multiplied by its weight: . The weights add up to 10, so the weighted mean is 76.9. The plain mean of the four marks is 73.75; it is lower because the high Maths mark has the biggest weight.
Question 7
The table shows the number of bicycles in each of 50 households of a village.
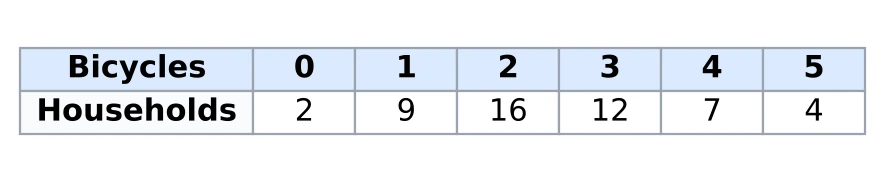
Find the mean number of bicycles per household.
Answer. I took 2 as the working mean, so the deviations are . Multiplying by the frequencies: . The mean is 2.5 bicycles.
Question 8
The table below has 50 values in all and a mean of 31. Find and .
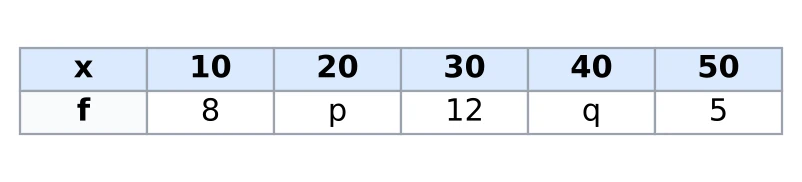
Answer. From the total, , so . From the mean, : Taking away leaves , and then . So and .
Question 9
With the values of and found in Question 8, find the median and the mode of the table.
Answer. The frequencies are now 8, 7, 12, 18, 5, and the cumulative frequencies are 8, 15, 27, 45, 50. , so the median is the mean of the 25th and 26th values. Both lie in the group with cf 27, so both are 30 and the median is 30. The highest frequency is 18, at , so the mode is 40. The answer is median 30, mode 40. Before was found, 30 with its 12 looked like the mode, but beats it.
Question 10
The table shows the weights of 60 students.

Find the mean weight.
Answer. For the mean I only need the class marks: , then 47, 52, 57 and 62. (Making the classes continuous would not change these.) With and , runs to 2: The mean is 51.5 kg.
Question 11
The mean marks of the class in the table are 25. Find .

Answer. I put the working mean at 15, the class mark of the class with the missing frequency, so that is multiplied by 0. With , the values of are , and . Then So .
Question 12
The weights (in kg) of nine parcels are 4.2, 3.8, 5.1, 2.9, 4.6, 3.5, 4.9, 3.1 and 4.4. Find the median weight.
Answer. In order: 2.9, 3.1, 3.5, 3.8, 4.2, 4.4, 4.6, 4.9, 5.1. There are 9 values, so the median is the 5th, 4.2 kg.
Question 13
A tenth parcel weighing 3.6 kg is added to the nine in Question 12. Find the new median.
Answer. 3.6 goes in between 3.5 and 3.8, so the list becomes 2.9, 3.1, 3.5, 3.6, 3.8, 4.2, 4.4, 4.6, 4.9, 5.1. With 10 values I need the 5th and 6th, 3.8 and 4.2. The median is 4 kg. A value added below the old median pulls the median down.
Question 14
The number of visitors to a museum on 11 days was 112, 98, 135, 120, 104, 150, 127, 91, 140, 116 and 108. Find the lower quartile, the upper quartile and the interquartile range.
Answer. In order: 91, 98, 104, 108, 112, 116, 120, 127, 135, 140, 150. With , the lower quartile is the rd value, 104, and the upper quartile is the th value, 135. The interquartile range is 31, with and . The median, the 6th value, is 116.
Question 15
The table shows the mobile data used in a month by 100 users.

Find the median data used.
Answer. . I wrote the cumulative frequencies: 6, 20, 60, 80, 92, 100. The first one to reach 50 is 60, so the median class is 8-12, with 20 users before it. The median is 11 GB.
Question 16
The frequency distribution below has 100 values in all, and its median is 34. Find and .

Answer. 34 lies in 30-40, so that is the median class: , , , and the cumulative frequency before it is . From the total, . So and . Check: the cf before 30-40 is 38 and after it is 68, so 50 does fall in this class.
Question 17
The table shows the marks of 60 students as a 'more than' cumulative table. No student scored 60 or more.
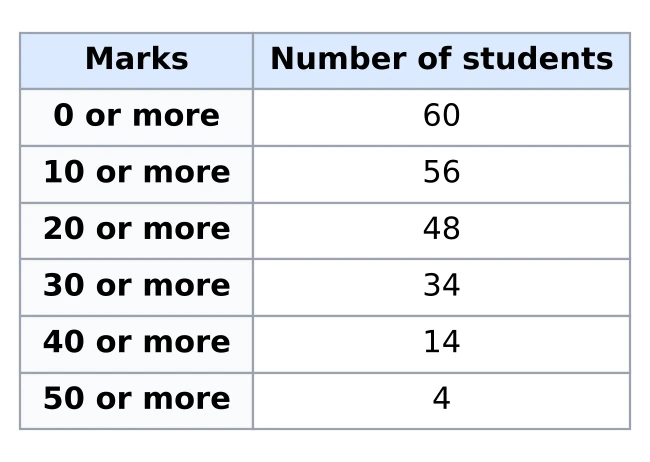
Find the median marks.
Answer. First I turned it into class frequencies by taking differences: 0-10 has , 10-20 has 8, 20-30 has 14, 30-40 has 20, 40-50 has 10 and 50-60 has 4. Then the usual cf column: 4, 12, 26, 46, 56, 60. falls in 30-40, with 26 before it. The median is 32 marks.
Question 18
The table shows the daily sales of 80 roadside tea stalls. No stall sells less than ₹ 150 a day.
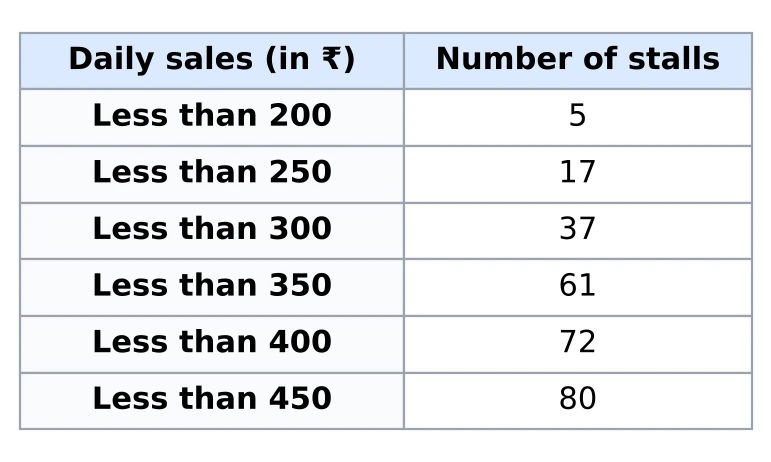
Find the median daily sales.
Answer. The 'less than' figures are already cumulative frequencies, so I can go straight to . 'Less than 300' is 37 and 'less than 350' is 61, so the median class is 300-350 with 37 stalls before it. Its frequency is . The median daily sales are ₹ 306.25.
Question 19
If the 'less than' ogive and the 'more than' ogive are drawn for the data in Question 18, at which point do they cross?
Answer. At the median, the number of stalls below and the number above are both half of 80. So the two curves cross where the sales figure is the median and the cumulative frequency is 40. The point is (306.25, 40).
Question 20
The table shows the heights of 120 saplings in a nursery.

Find the modal height.
Answer. The highest frequency, 35, is in 50-60, so , , , and . The modal height is 56 cm. It is above 55 because the class after the modal class is bigger than the class before it.
Question 21
The table shows the number of days that 50 students were absent in a term.

Find the mode.
Answer. The modal class is the first one, 0-4. There is no class before it, so , with and . The mode is 3 days.
Question 22
The mode of the distribution below is 66. Find .

Answer. A mode of 66 means the modal class is 60-70, so , and . So and . It is the largest frequency, as the modal class needs.
Question 23
For the data 14, 18, 11, 20, 16, 18, 13, 22, 17 and 21, find the mean and the median, and then the mode by the empirical relation.
Answer. The total is 170, so the mean is . In order the data are 11, 13, 14, 16, 17, 18, 18, 20, 21, 22, and the median is . Then By the empirical relation the mode is 18.5. Counting the values gives 18 (it appears twice), so the relation is close but not exact; use it when the question asks for it.
Question 24
In a distribution, the mean is 34.8 and the median is 36.2. Find the mode.
Answer. 39. Here the mean is below the median, so the mode comes out above both.
Question 25
In a moderately skewed distribution, the mean is 2 more than the median and the mode is 38. Find the mean.
Answer. . So the mean is 44, and the median is 42.
Question 26
The table shows the marks of 100 students in a test.
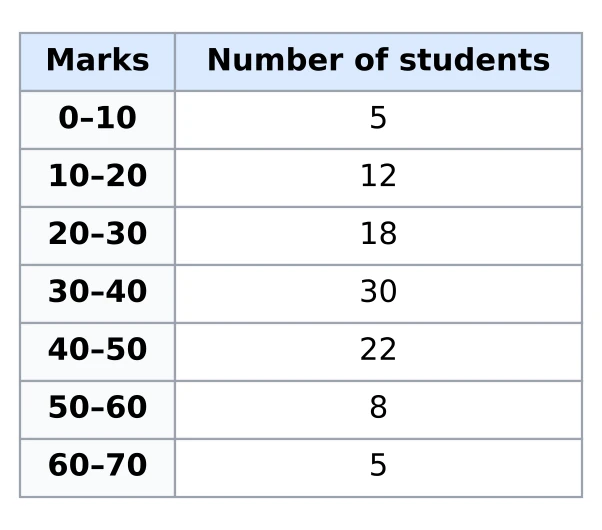
Find the mean marks.
Answer. The class marks are 5, 15, …, 65. I took and :
| 0 | 1 | 2 | 3 | ||||
|---|---|---|---|---|---|---|---|
| 0 | 22 | 16 | 15 |
, so the mean is 34.6 marks.
Question 27
For the same table, find the median marks.
Answer. The cumulative frequencies are 5, 17, 35, 65, 87, 95, 100. falls in 30-40, with 35 students before it and 30 in it. The median is 35 marks.
Question 28
For the same table, find the mode, and compare it with the value given by the empirical relation.
Answer. The modal class is 30-40, with , and . The empirical relation gives . So the mode is 36, and the relation's 35.8 is close to it. Mean 34.6, median 35, mode 36: the three are in the order the relation expects.
Question 29
Seven people waited 12, 3, 30, 10, 2, 38 and 5 minutes for a bus. Find the range and the mean deviation about the median.
Answer. The range is minutes. In order the times are 2, 3, 5, 10, 12, 30, 38, so the median is 10. The distances from 10 are 8, 7, 5, 0, 2, 20 and 28, which add up to 70. The mean deviation about the median is . So the answer is range 36 minutes, mean deviation 10 minutes.
Question 30
The ages (in years) of eight players are 21, 33, 18, 24, 17, 28, 20 and 23. Find the standard deviation of their ages.
Answer. The total is 184, so the mean is 23. The deviations from 23 are , and their squares add up to . The variance is , and the SD is 5 years.
I checked with the other formula: the squares of the ages add up to 4432, and .
Question 31
The table shows the number of items that 30 workers made in a day.

Find the standard deviation.
Answer. I used , which runs . Then and . Dividing by 10 divided the variance by 100, so I multiply back: , and the SD is 14 items. The mean, if needed, is .
Question 32
The mean and the standard deviation of 20 observations are 25 and 4. Later it was found that one observation, 40, had been recorded as 20. Find the correct mean and standard deviation.
Answer. First the totals. . From , .
Now I correct both: , and .
The correct mean is , and the correct variance is . So the answer is mean 26, SD 5.
Question 33
The coefficient of variation of a set of values is 25% and its standard deviation is 4.5. Find the mean. If 6 is then added to every value, what does the coefficient of variation become?
Answer. gives . Adding 6 to every value makes the mean 24 but leaves the SD at 4.5, so the new CV is . The answer is mean 18, new CV 18.75%.
Question 34
Find the standard deviation of the first 10 even natural numbers.
Answer. 2, 4, …, 20 are 10 values in steps of 2. The variance of is , and doubling every value multiplies the variance by 4, giving 33. So the SD is , about 5.74.