
Mean of a List
- Mean , so the sum is the mean times the count.
- Values in equal steps: mean .
- First natural numbers: ; first even: ; first odd: .
- Squares of 1 to : .
- Working mean : , where .
- Deviations from the mean add up to 0.
For example: the mean of 6, 9, 12, …, 60 is .
When the Values Change
- A wrong value corrected: the mean changes by .
- A value added or removed: find the new total and divide by the new count.
- Add to every value: the mean, median and mode go up by . Multiply by : they are multiplied by . So gives .
For example: 10 values have mean 18, but 27 was read as 72. The mean falls by , to 13.5. Word problems on averages are in Chapter 5.
Weighted and Combined Mean
- Weighted mean .
- Combined mean of groups .
- It lies between the group means, nearer to the mean of the bigger group.
- Two groups with combined mean : .
- The plain average of the group means works only for groups of equal size.
For example: 25 men with mean age 40 and 15 women with mean age 32: years, not 36.
Mean of a Frequency Table
- Discrete table: .
- Grouped table: use class marks, .
- Assumed mean: , with .
- Step deviation: and .
- A missing frequency: use , or put at the value whose frequency is missing.
- The plain mean of the class marks, without the frequencies, is not the mean of the table.
Median of a List and a Discrete Table
- Arrange the values in order first.
- odd: the median is the -th value. even: it is the mean of the -th and the -th values.
- Discrete table: write the cumulative frequencies and see where those positions fall.
- The two middle values can fall in different rows; then the median is their mean.
For example: 9, 4, 15, 7, 12, 4 in order is 4, 4, 7, 9, 12, 15, so the median is .
Median of Grouped Data
- The median class is the first class whose cumulative frequency reaches .
- belongs to the class before the median class.
- Inclusive classes (10-19, 20-29) first become 9.5-19.5, 19.5-29.5.
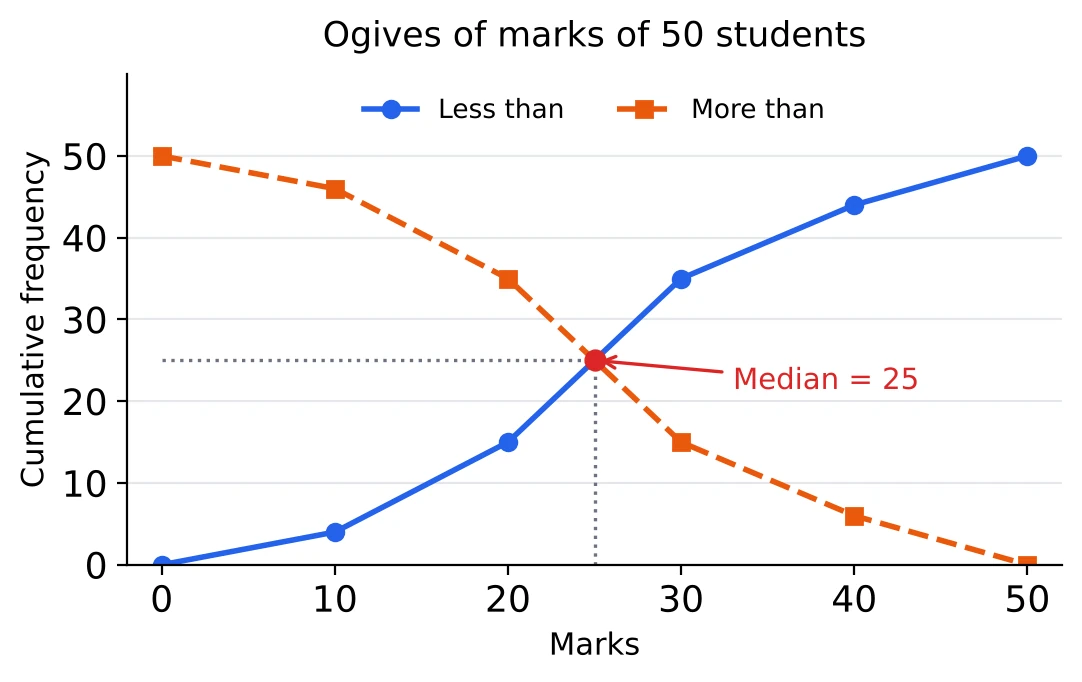
- 'Less than' figures are already cumulative; 'more than' figures give class frequencies by subtraction.
- The 'less than' and 'more than' ogives cross at the median, where each reaches .
Quartiles
- Lower quartile : the -th value in order.
- Upper quartile : the -th value in order.
- The median is the middle quartile, .
- Interquartile range . It is the spread of the middle half of the data, so extreme values do not affect it.
For example: for 3, 5, 6, 8, 10, 11, 13 (), is the 2nd value, 5, the median is 8, and is the 6th value, 11. The interquartile range is .
Mode
- The mode is the value that occurs most often. A list can have one mode, two modes, or none when every value occurs once.
- Discrete table: the value with the highest frequency.
- Grouped data: , with for the modal class and , for the classes before and after it.
- The mode leans towards the bigger neighbour; when , it is the middle of the class.
- If the modal class is the first class, .
Empirical Relation and Choosing an Average
- for moderately skewed data; also .
- Symmetric data: mean, median and mode are equal.
- A long tail of high values: . A long tail of low values: the order is reversed.
- The mode suits the most common size (shoes, shirts); the median suits data with a few extreme values (incomes); the mean uses every value.
For example: mean 40 and median 38 give .
Range and Mean Deviation
- Range largest value smallest value.
- Coefficient of range .
- Mean deviation about the mean . About the median, use the median in place of .
- Mean deviation adds distances, so all the signs are dropped.
For example: for 4, 6, 9, 13, 18, the range is 14 and the coefficient of range is . The mean is 10, the distances from it are 6, 4, 1, 3, 8, and the mean deviation is .
Variance and Standard Deviation
- , and .
- Frequency table: .
- With : .
- Two values and : .
- First natural numbers: .
- is never negative, and it is 0 only when all the values are equal.
Changes and the Coefficient of Variation
- Adding or subtracting : the variance and the SD do not change.
- Multiplying by : the SD is multiplied by and the variance by .
- . The smaller CV belongs to the more consistent data.
- SDs alone can be compared only when the means are equal.
For example: marks with SD 3, doubled and then raised by 5, have SD 6 and variance 36. Mean 50 with SD 5 (CV 10%) is more consistent than mean 30 with SD 4.5 (CV 15%).
Before the Exam
Mistakes to watch for:
- the median of a list taken before sorting;
- used for grouped data;
- the cf of the median class used in place of the class before;
- and swapped, or left out;
- written for the mode;
- the variance given when the SD is asked;
- the SD changed by adding a constant, or used for ;
- inclusive classes not made continuous.
Chapter Test: 25 questions in 25 minutes; right, wrong.