
What the Mode Is
The mode is the value that occurs most often in the data. Of the three averages it is the only one you find by counting rather than by calculating.
The shoe sizes of 12 customers at a shop were
Count how many times each size occurs:
| Shoe size | 6 | 7 | 8 | 9 | 10 |
|---|---|---|---|---|---|
| Number of customers | 2 | 4 | 2 | 3 | 1 |
Size 7 occurs 4 times and no other size occurs as often, so the mode is 7. The answer is the size, 7, and not the count, 4. Some options are made from the count, so read your answer back against the question.
You need not arrange the data to find the mode, but writing it in order puts equal values side by side and makes the counting safe: 6, 6, 7, 7, 7, 7, 8, 8, 9, 9, 9, 10.
One mode, two modes, no mode.
- 4, 6, 5, 6, 9, 4, 8: the values 4 and 6 both occur twice and the rest once. This data has two modes, 4 and 6, and is called bimodal. Three tied values give three modes.
- 12, 15, 18, 21, 24: every value occurs once. Nothing repeats, so there is no mode.
- 3, 3, 5, 5, 8, 8: every value occurs the same number of times. No value stands out, so again there is no mode.
A missing value from the mode. The data 12, 15, , 19, 15, , 12, 20 has the mode 15. Find .
Leaving out , the values 12 and 15 occur twice each. The unknown appears twice, so whatever value it is gains two more. If , then 12 occurs four times and the mode would be 12. If were 19 or 20, that value would occur three times and become the mode. Only makes 15 occur four times, more often than anything else. So .
Mode of a Frequency Table
When the data comes as values with their frequencies, the counting has already been done. The mode is the value against the highest frequency.
The number of children in 40 families of a village:
| Number of children () | 0 | 1 | 2 | 3 | 4 | 5 |
|---|---|---|---|---|---|---|
| Number of families () | 4 | 9 | 15 | 7 | 3 | 2 |
The highest frequency is 15, and it stands against . So the mode is 2 children.
Three other numbers in this table can be picked by mistake: 15 is the highest frequency, 5 is the largest value and 40 is the total. The mode is always one of the values in the row.
Two equal highest frequencies. If 1 child also had 15 families against it, the table would have two modes, 1 and 2.
How many more to change the mode? How many more families with 3 children would make 3 the only mode? The frequency of 3 must rise above 15, to at least 16, so at least more families are needed. With 8 more it would only tie with 2, and the data would have two modes.
Changing every value. The frequencies do not change, so the same item keeps the highest frequency; only its value is changed.
- Add or subtract a number to every value: the mode goes up or down by .
- Multiply or divide every value by : the mode is multiplied or divided by .
If the mode of a data set is 18, and every value is doubled and then 5 is added, the new mode is . Do the steps in the order the question gives them. The mean and the median change in exactly the same way.
Mode of Grouped Data
A grouped table tells you how many values lie in each class, not the values themselves, so the mode cannot be counted. Instead you find the class with the highest frequency, called the modal class, and estimate the mode inside it:
where
- = lower limit of the modal class (its lower boundary if the classes have gaps),
- = frequency of the modal class,
- = frequency of the class just before it,
- = frequency of the class just after it,
- = class width.
The daily wages of 50 workers:
| Daily wages (₹) | 200-250 | 250-300 | 300-350 | 350-400 | 400-450 | 450-500 |
|---|---|---|---|---|---|---|
| Number of workers | 5 | 8 | 14 | 10 | 9 | 4 |
Step 1. The highest frequency is 14, so the modal class is 300-350.
Step 2. Read off the five numbers: , , , , .
Step 3. Put them in:
The modal daily wage is ₹ 330.
The denominator as two differences. , here . Seen this way, the mode cuts the class width in the ratio . The class of width 50 is cut in the ratio , and the first part, , is added to .
A check on the answer. The mode lies inside the modal class, and it leans towards the bigger of the two neighbours. Here the class after (10) is bigger than the class before (8), so the mode is above the middle of the class, 325. If , the mode is exactly the class mark.
The Mode on a Histogram
The formula has a picture behind it. Draw the histogram of the wage table and look at the tallest bar, which stands on the modal class.
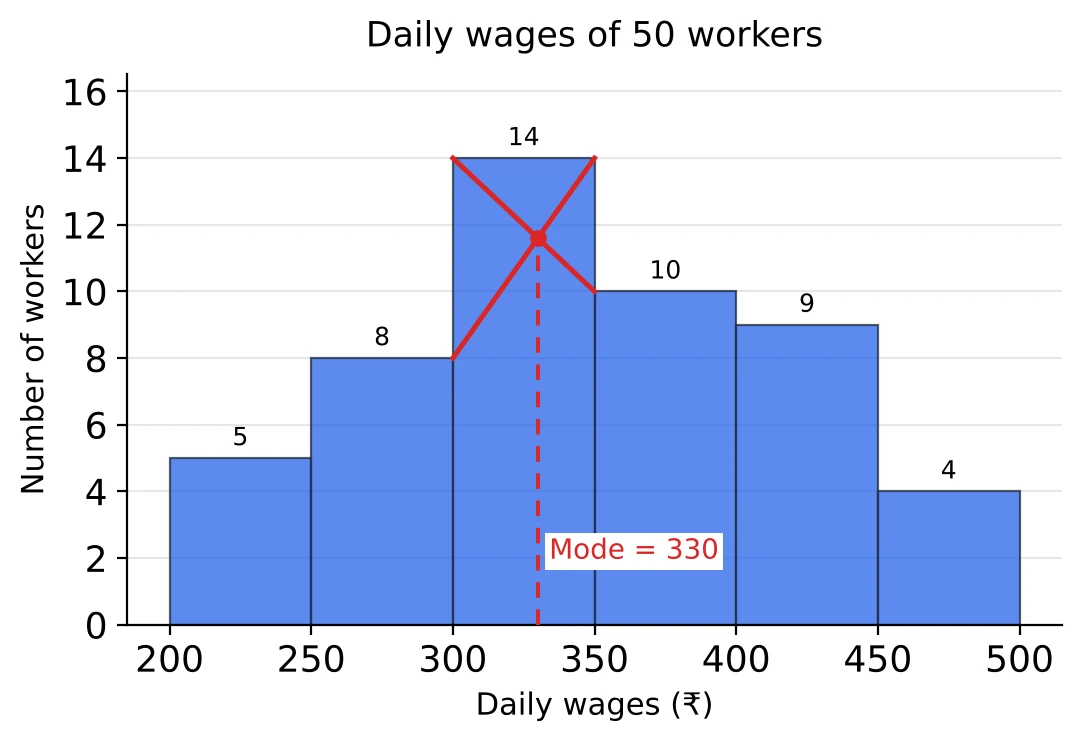
Join the top right corner of the bar before it (height 8, at 300) to the top right corner of the tallest bar (height 14, at 350). Then join the top left corner of the tallest bar (height 14, at 300) to the top left corner of the bar after it (height 10, at 350). The two lines cross. Drop a line from the crossing point to the horizontal axis: it meets the axis at 330, the same mode the formula gave.
The crossing point is pulled towards the taller neighbour. If the two neighbouring bars were equally tall, the lines would cross exactly above the middle of the modal class, which is the case of the formula.
This is why the mode is one of the two averages that can be found from a graph: the mode from a histogram, and the median from the ogives (see the Median section). The mean has no such graph method.
A question may give the data as a histogram instead of a table. Read the class limits from the edges of the bars and the frequencies from their heights (Chapter 18 shows how), then use the formula as usual.
Mode Formula: Special Cases
Inclusive classes. Classes such as 10-19, 20-29, 30-39 leave a gap between 19 and 20. Before using the formula, make them continuous: take 0.5 off every lower limit and add 0.5 to every upper limit, so 30-39 becomes 29.5-39.5. Then is the lower boundary and is 10.
The marks of 55 students:
| Marks | 10-19 | 20-29 | 30-39 | 40-49 | 50-59 |
|---|---|---|---|---|---|
| Number of students | 5 | 12 | 18 | 14 | 6 |
The modal class is 30-39, that is 29.5-39.5. With , and :
Taking would put the answer half a mark too high, at 36.
The class width on its own. For 30-39 the width is 10: the distance from one lower limit to the next (30 to 40), or from boundary to boundary (29.5 to 39.5). The difference of the written limits, , is not the width. When only the class marks are given, the width is the gap between two marks next to each other: marks 15, 25, 35 mean a width of 10.
The modal class at either end. If the first class is the modal class, there is no class before it, so . Waiting times at a bank counter:
| Waiting time (minutes) | 0-10 | 10-20 | 20-30 | 30-40 | 40-50 |
|---|---|---|---|---|---|
| Number of customers | 18 | 12 | 8 | 5 | 2 |
In the same way when the last class is the modal class.
Cumulative tables. If the table gives 'less than' or 'more than' totals, first turn them back into class frequencies by subtracting each total from the next one (see Chapter 18), and only then look for the modal class.
[SSC Tip] Before you mark an option, check that it lies inside the modal class and on the side of the bigger neighbour. Swapping and in the numerator keeps the answer inside the class but moves it to the wrong side: for the marks above it gives 33.5 instead of 35.5.
A Missing Frequency from the Mode
Here the mode is given and one frequency is unknown. The given mode tells you the modal class: it is the class the mode lies in.
The speeds of some vehicles passing a check post:
| Speed (km/h) | 10-20 | 20-30 | 30-40 | 40-50 | 50-60 | 60-70 |
|---|---|---|---|---|---|---|
| Number of vehicles | 5 | 8 | 16 | 10 | 6 |
The mode is 46 km/h. Find .
The mode 46 lies in 40-50, so that is the modal class: , , , , .
Check: with the class 40-50 still has the highest frequency, 16, so it really is the modal class. And 46 is above the class mark 45, on the side of the bigger neighbour (10 against 7), as it should be.
Steps for any such question.
- Find the class that contains the given mode. That is the modal class.
- Write , , , and , with the unknown where it belongs. It may be , or itself.
- Subtract from the mode first, which keeps the equation small. Then cross-multiply and solve.
- Check that the modal class still has the highest frequency.
If the total of all the frequencies is also given, it supplies a second equation, so two unknown frequencies can be found: one from the total and one from the mode.
The width as the unknown. The same equation can be solved for . If the mode is 63, the modal class starts at 60, and , , , then , so .
The Empirical Formula
For a distribution that is only moderately skewed (not badly lopsided), the mean, median and mode are linked by a relation found from observation:
It is approximate, but questions use it as exact whenever two of the three are given. Keep all three forms ready:
| To find | Use |
|---|---|
| Mode | |
| Median | |
| Mean |
Mode from the mean and the median. Mean 42, median 40: .
Mean from the mode and the median. Mode 24, median 27: .
Median from the mean and the mode. Mean 50, mode 41: .
The difference form. Subtracting the mode from the mean and using the relation gives
So the gap between the mean and the mode is three times the gap between the mean and the median. With mean 42 and median 40 the second gap is 2, so the mode is below the mean: 36 again. When a question gives only a difference, this form is the quickest.
The median always lies between the mean and the mode, one third of the way from the mean towards the mode. Check the first case: from 42 down to 36 is 6, a third of it is 2, and is the median.
The wrong form, , gives 46 for mean 42 and median 40. That puts the mode on the far side of the mean, which cannot happen, since the median must lie between the other two.
[SSC Tip] When a question asks for the mode of a list 'using the empirical formula', find the mean and the median of the list and use the relation, even if some value in the list repeats. The answer it wants is the empirical one.
Mean, Median and Mode Compared
Symmetric data. When the data is spread evenly on both sides of its centre, the three averages are equal:
For 2, 4, 4, 6, 6, 6, 8, 8, 10: the mean is , the middle (fifth) value is 6, and 6 occurs most often. So if a symmetric distribution has mean 35, its median and mode are 35 too, and if the three add up to 105, each of them is .
Skewed data. When a few values are much larger or much smaller than the rest, the data has a long tail on one side. The mean is pulled towards the tail, the mode stays at the peak, and the median lies between them.
| Shape of the data | Order of the averages |
|---|---|
| Symmetric | |
| Positively skewed: long tail to the right, a few very large values | |
| Negatively skewed: long tail to the left, a few very small values |
Incomes in a town are positively skewed: a few very high incomes lift the mean above what most people earn. Marks in an easy test are negatively skewed: most students score high, a few score very low, and those few pull the mean below the median.
The order fits the empirical formula. Mean 30, median 28 and mode are in the order , so a distribution with these averages is positively skewed.
For symmetric and moderately skewed data, the median is the middle one of the three. To say which of the three is the largest, first decide which side the tail is on: the mean is the largest when the tail is on the right and the smallest when it is on the left.
Choosing the Right Average
Each average answers a different question, and a question may ask which one suits a situation.
| Situation | Best average | Why |
|---|---|---|
| The shoe or shirt size a shop should stock in the largest number | Mode | It is the size bought by the most customers |
| The blood group, colour or brand chosen by the most people | Mode | The data is not numbers, so it cannot be added or arranged |
| A typical income in a town, or the price of a typical house | Median | A few very large values pull the mean up; the median does not depend on how large they are |
| A table whose last class is open, such as '60 and above' | Median | The open class has no class mark, so the mean cannot be found |
| Average marks of a class, average runs per innings | Mean | Every value counts, and the total can be found back as the mean times the number of values |
Three facts asked as one-line questions.
- The mean is the average most affected by extreme values. The median and the mode hardly move when one value becomes very large.
- The mode is the only average that can be found for data that is not numerical.
- The median and the mode can be found from a graph (the ogives and the histogram); the mean cannot.
A data set may have no mode or more than one mode, but it always has exactly one mean and exactly one median.
When the mean of a set of sizes or counts is not a whole number, it may not be a value that exists at all: an average family of 3.4 members, a mean shoe size of 7.6. The mode, when there is one, is a value that really occurs in the data, which is why a shopkeeper looks at it.
[SSC Tip] When the options are 'mean', 'median', 'mode' and 'range', the range can be crossed out first: it is not an average at all but a measure of spread.
Solved Examples
Question 1
The numbers of goals scored by a hockey team in 15 matches were 2, 3, 1, 0, 2, 4, 3, 2, 1, 2, 5, 3, 2, 0, 1. What is the modal number of goals? (a) 5 (b) 3 (c) 2 (d) 1
Answer. I counted each value: 0 came twice, 1 three times, 2 five times, 3 three times, 4 once and 5 once. The value 2 comes the most times, so the mode is (c) 2. The 5 is how many times 2 came, and it is also the most goals in one match, so I made sure I was giving the number of goals.
Question 2
The ages (in years) of 10 children in a dance class are 9, 11, 10, 12, 9, 13, 11, 10, 9, 11. What is the mode of the ages? (a) 9 and 11 (b) 9 only (c) 11 only (d) 10
Answer. In order the ages are 9, 9, 9, 10, 10, 11, 11, 11, 12, 13. Both 9 and 11 come three times, and no age comes more often. So the data has two modes, (a) 9 and 11. If I had stopped at the first age that comes three times, I would have missed one of them.
Question 3
The mode of the data 8, 11, 9, 8, , 11, 9, 11, 8, is 9. What is the value of ? (a) 8 (b) 9 (c) 11 (d) 10
Answer. Leaving out , 8 comes three times, 11 comes three times and 9 only twice. For 9 to be the mode it has to beat both, so both 's must be 9. Then 9 comes four times and is the only mode. So is (b) 9. If were 8 or 11, that number would come five times and be the mode instead.
Question 4
A shop recorded the sizes of the pairs of shoes it sold in one day.

What is the modal shoe size? (a) 8 (b) 24 (c) 10 (d) 7
Answer. The biggest number in the second row is 24, and it is under size 8. So the mode is (a) 8. The 24 is only how many pairs of size 8 were sold; the mode has to be a size.
Question 5
How many more pairs of size 7 must the shop sell for size 7 to become the only modal size? (a) 5 (b) 19 (c) 6 (d) 24
Answer. Size 7 has 19 pairs and size 8 has 24. To be the only mode, size 7 needs more than 24, so at least 25. That is more pairs, (c) 6. With 5 more it would be 24, the same as size 8, and the data would have two modes.
Question 6
The mode of a set of observations is 24. Each observation is first increased by 6 and then divided by 3. What is the mode of the new observations? (a) 14 (b) 8 (c) 30 (d) 10
Answer. The mode goes through whatever is done to every value, so I do the same steps to 24: , then . The new mode is (d) 10. The order matters here: dividing first and then adding 6 would give .
Question 7
The marks obtained by 70 students in a test out of 100 are given below.
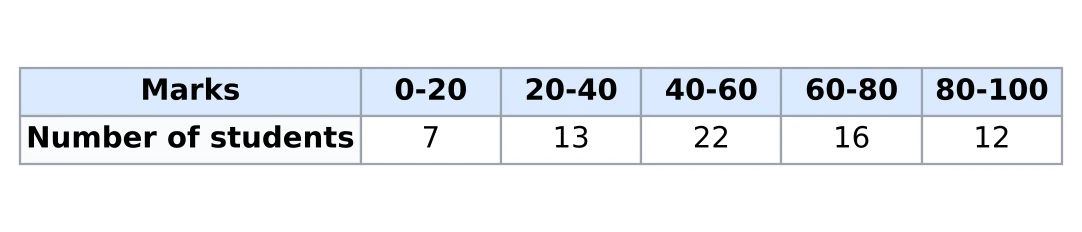
What is the mode of the marks? (a) 50 (b) 52 (c) 48 (d) 40.6
Answer. The highest frequency is 22, so the modal class is 40-60. That gives , , , and .
The mode is (b) 52. It is a little above 50, the middle of the class, because the class after (16) is bigger than the class before (13).
Question 8
The ages (in years) of the 70 members of a club are given below.

What is the modal age of the members? (a) 47 years (b) 47.5 years (c) 42 years (d) 46.25 years
Answer. These classes have gaps (between 39 and 40, 49 and 50), so first I make them continuous: 40-49 becomes 39.5-49.5. The modal class is 39.5-49.5 with 25 members, so , , , , .
So the modal age is (a) 47 years. If I had used , I would have got 47.5, half a year too much.
Question 9
What is the width of the modal class? (a) 9 (b) 11 (c) 5 (d) 10
Answer. The modal class is 40-49. Its width is the gap from its lower limit to the next class's lower limit, . The boundaries give the same: . So the width is (d) 10. Just subtracting the written limits, , leaves out the half year at each end.
Question 10
The number of mistakes made by 50 typists in typing one page is given below.
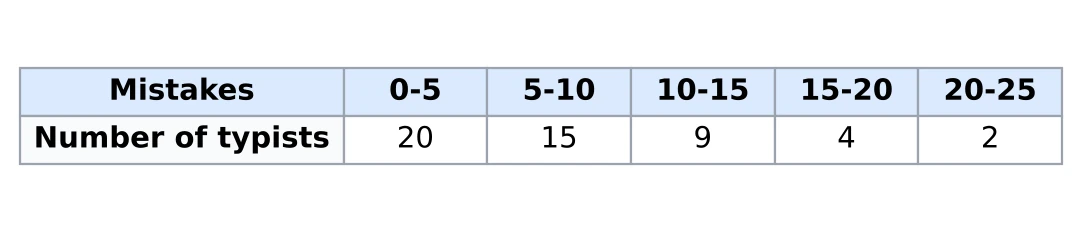
What is the mode of the number of mistakes? (a) 2.5 (b) 1 (c) 4 (d) 20
Answer. The first class, 0-5, has the highest frequency, 20, so it is the modal class. There is no class before it, so I take . With , , and :
So the mode is (c) 4 mistakes. The answer lies inside 0-5, as it must.
Question 11
The table shows the number of hours some students spent watching television in a week. The mode of the data is 34 hours.

What is the value of ? (a) 14 (b) 11 (c) 9 (d) 12
Answer. 34 lies in the class 30-40, so that is the modal class, with , and . Then
So and . The answer is (b) 11. With 11 in that place, the class 30-40 still has the highest frequency, so it really is the modal class.
Question 12
The time taken by 60 students to reach school is given below as 'less than' totals: for example, 15 students took less than 20 minutes.

What is the modal time? (a) 24 minutes (b) 25 minutes (c) 55 minutes (d) 26 minutes
Answer. First I turn the totals back into class frequencies by subtracting each total from the next: 0-10: 4, 10-20: , 20-30: , 30-40: , 40-50: , 50-60: . The biggest is 20, for 20-30. So , , , and :
The modal time is (d) 26 minutes. The 60 at the bottom of the table is just the total, not a frequency.
Question 13
The heights of 50 plants in a nursery are given below.
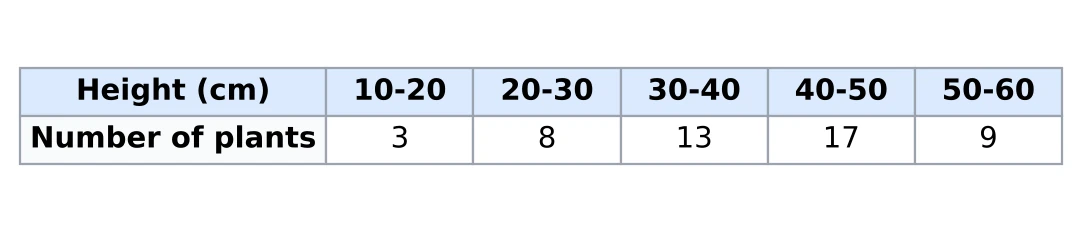
What is the modal height, correct to two decimal places? (a) 43.33 cm (b) 46.67 cm (c) 45.00 cm (d) 40.33 cm
Answer. The modal class is 40-50, with 17 plants. The class before has 13 and the class after has 9.
So the mode is 43.33 cm to two decimal places, which is (a) 43.33 cm. It is below the class mark 45 because the class after is the smaller neighbour.
Question 14
For a moderately skewed distribution, the mean is 34.5 and the median is 32.4. What is the mode? (a) 38.7 (b) 30.3 (c) 28.2 (d) 31.7
Answer. I use . That is . So the mode is (c) 28.2. It is below both the median and the mean, which fits: the mean is the largest of the three, so the tail is on the right.
Question 15
In a moderately skewed distribution, the mode is 18 and the median is 21. What is the mean? (a) 16.5 (b) 22.5 (c) 24 (d) 27
Answer. From I get . So the mean is , which is (b) 22.5. To check, the median should be a third of the way from the mean to the mode. From 22.5 to 18 is 4.5, a third of that is 1.5, and . It fits.
Question 16
The mean and the mode of a moderately skewed distribution are 60 and 51. What is the median? (a) 55.5 (b) 54 (c) 59 (d) 57
Answer. . So the median is (d) 57. I did not take the halfway point between 60 and 51, because the median is only a third of the way from the mean to the mode.
Question 17
In a moderately skewed distribution, the mean exceeds the mode by 12. By how much does the mean exceed the median? (a) 4 (b) 36 (c) 6 (d) 8
Answer. The empirical formula can be written as . So , and the mean is 4 more than the median. The answer is (a) 4. I did not need any of the three values themselves.
Question 18
Using the empirical relation between the mean, median and mode, find the mode of 10, 13, 5, 19, 9, 11, 15, 7, 10. (a) 10 (b) 13 (c) 8 (d) 11
Answer. Mean: the numbers add to 99 and there are 9 of them, so the mean is 11. Median: in order they are 5, 7, 9, 10, 10, 11, 13, 15, 19, and the fifth one is 10. Then the empirical mode is . The answer is (c) 8. The number that really repeats in the list is 10, but the question asks for the mode from the relation.
Question 19
The mean, median and mode of a distribution are 56, 52 and 44. What is the shape of the distribution? (a) Negatively skewed (b) Positively skewed (c) Symmetric (d) It cannot be told from these values
Answer. The mean is the biggest and the mode the smallest: . Some large values have pulled the mean up, so the long tail is on the right. That makes it (b) Positively skewed. For a symmetric shape the three would be equal, and with the tail on the left the order would be the other way round.
Question 20
In a symmetric distribution, the sum of the mean, median and mode is 126. What is the mode? (a) 63 (b) 21 (c) 84 (d) 42
Answer. In a symmetric distribution the mean, the median and the mode are all equal. So each one is , and the mode is (d) 42.
Question 21
A shop sells readymade shirts with collar sizes 38, 39, 40, 42 and 44. To decide which size to keep in the largest number, which average should it look at? (a) Mode (b) Mean (c) Median (d) Range
Answer. The shop wants the size that the most customers buy, which is the size that occurs most often in its sales. That is the (a) Mode. The mean of the sizes sold could easily come out as something like 40.6, which is not even a size the shop sells.
Question 22
The monthly incomes (in ₹ thousand) of 9 families in a colony are 18, 20, 21, 22, 24, 25, 26, 28 and 248. Which of these best describes the income of a typical family? (a) The mean, ₹ 48 thousand (b) The middle of the range, ₹ 133 thousand (c) The median, ₹ 24 thousand (d) The largest income, ₹ 248 thousand
Answer. The mean is thousand, but eight of the nine families earn less than that, because one family with ₹ 248 thousand pulls it up. The median is the fifth income in order, 24 thousand, and it sits right among the others. So (c) The median, ₹ 24 thousand is the better description. No income repeats, so this data has no mode at all.