
Reading a Simple Bar Graph
A bar graph shows each value as the height of a bar. The categories (years, months, cities) run along one axis and the values along the other, measured against a scale.
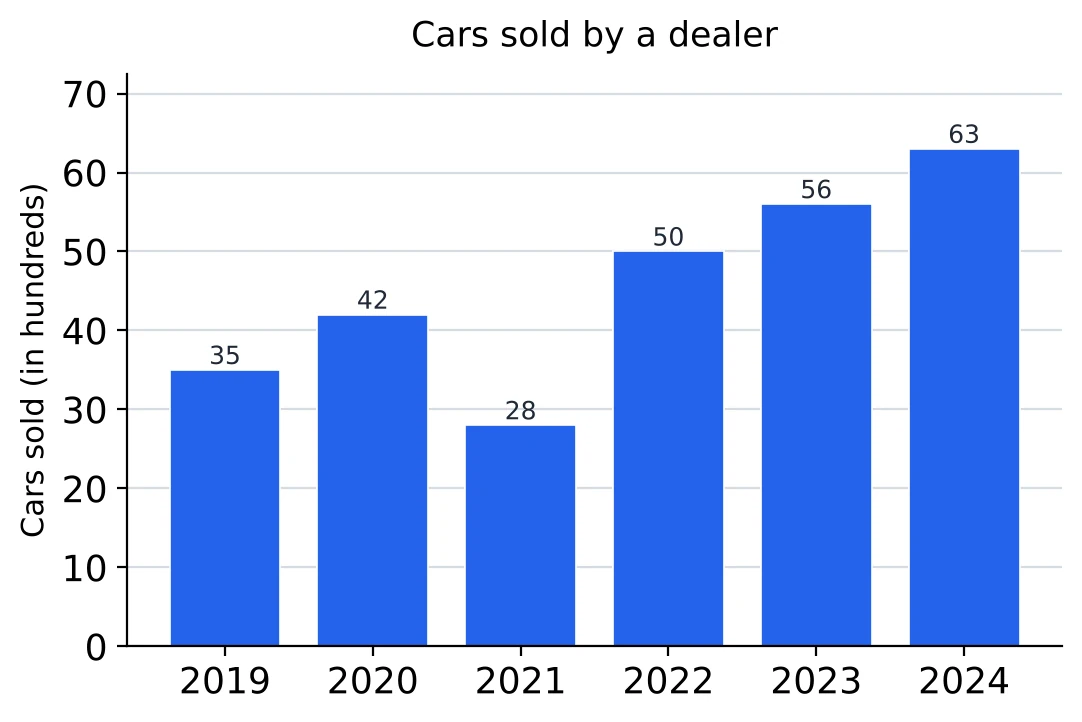
Look at four things before any question:
- The title, which says what the bars measure.
- The axis label and its unit. Here it is “Cars sold (in hundreds)”, so the 2022 bar, marked 50, stands for 5,000 cars.
- The scale. Here it starts at 0 and the lines are 10 apart.
- Whether the values are printed on the bars. When they are, use the printed numbers and don't estimate from the heights.
What the heights tell you at a glance. The tallest bar is the highest value (2024, 63 hundred) and the shortest is the lowest (2021, 28 hundred). The step from one bar to the next shows the rise or fall, and the biggest jump is from 2021 to 2022, 22 hundred. Questions like these need no calculation at all.
Totals with the unit. Cars sold in the six years: hundred, that is 27,400 cars. A question asking “how many cars” wants 27,400, and 274 will be one of the wrong options.
Order of the bars. When the bars are years, they stand in time order, so a rise from year to year shows as a climb from left to right. When they are cities or products, the order means nothing, and “the second highest” has to be found by sorting the values yourself.
Comparing heights. In which year were the sales half of the 2023 sales? Half of 56 is 28, which is the 2021 bar. Halves, doubles and equal bars can be spotted by height alone and then confirmed with the printed numbers.
Horizontal Bar Graphs
When the category names are long, or there are many of them, the bars are drawn across the page. A horizontal bar graph is read exactly like a vertical one: the length of a bar, measured against the scale at the bottom, gives its value.
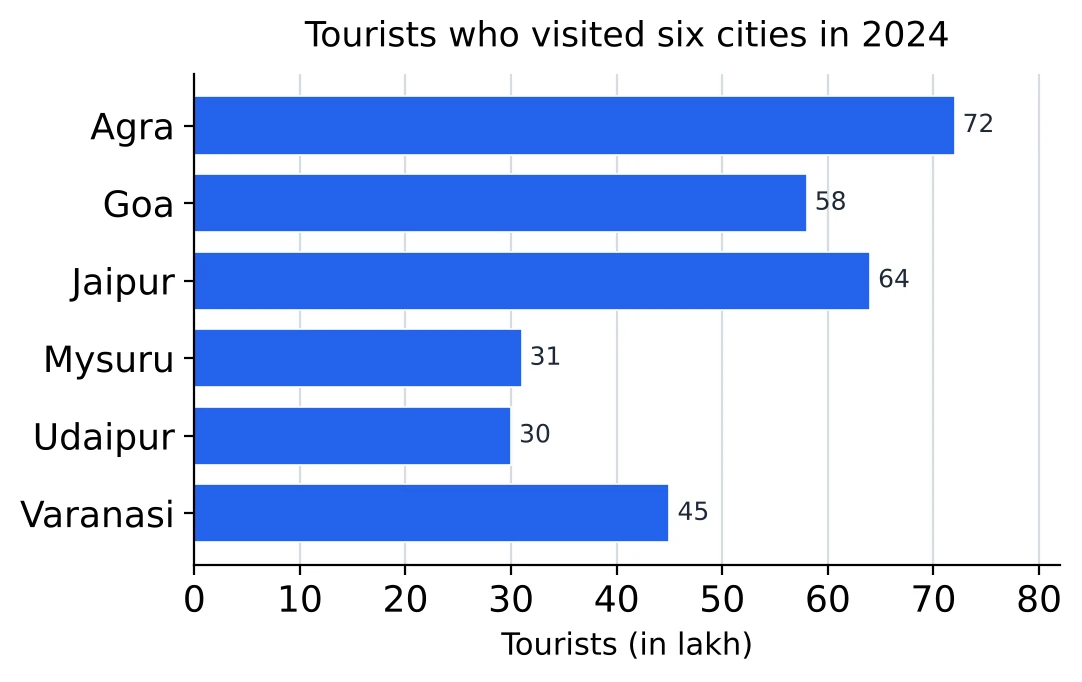
- The categories are listed down the left side and the values along the bottom.
- The longest bar is the largest value: Agra, 72 lakh.
- The bars are not in order of size, so for “the second highest” or “the second lowest” you sort them yourself: 72, 64, 58, 45, 31, 30. The second highest is Jaipur (64) and the second lowest Mysuru (31).
Sums and averages. All six cities: lakh, so the average is lakh per city. Agra, Goa and Jaipur are above the average, the other three below it.
Differences. The gap between the most and the least visited cities is lakh. Mysuru and Udaipur look the same length; only the printed values (31 and 30) tell them apart, so with close bars always read the numbers.
Sharing out a total. What percentage of the tourists to these six cities went to Varanasi? . The total of 300 from the line above is used again here, which is why it is worth writing down the first time.
Large units. 72 lakh is 72,00,000, or 7.2 million (1 million = 10 lakh). Options may be written either way.
Reading Values off the Grid
Not every bar graph prints its values. Then each bar has to be read against the scale, and the first job is to find what one gridline is worth.
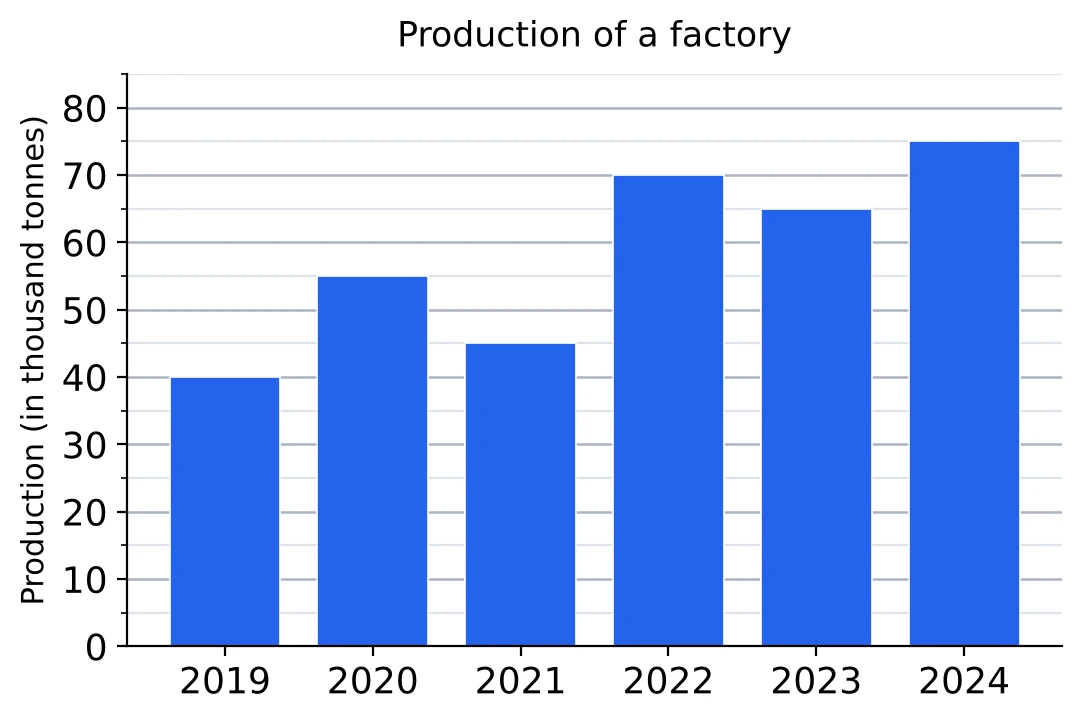
Find the step. The labelled lines here are 0, 10, 20 and so on up to 80, with a fainter line halfway between each pair. So the labelled lines are 10 apart and each faint line adds 5.
Read the top edge. Run your eye, or the edge of a sheet of paper, straight across from the top of a bar to the scale. The 2019 bar stops at the 40 line; 2020 stops at the faint line between 50 and 60, which is 55; 2022 stops at 70. All six readings are 40, 55, 45, 70, 65 and 75.
Write the readings down. Put each value above its bar on your rough sheet. The two or three questions on the graph then use the same readings, and a wrong one shows up when the numbers sit side by side.
Does the axis start at zero? Look at the lowest number on the value axis before comparing heights.
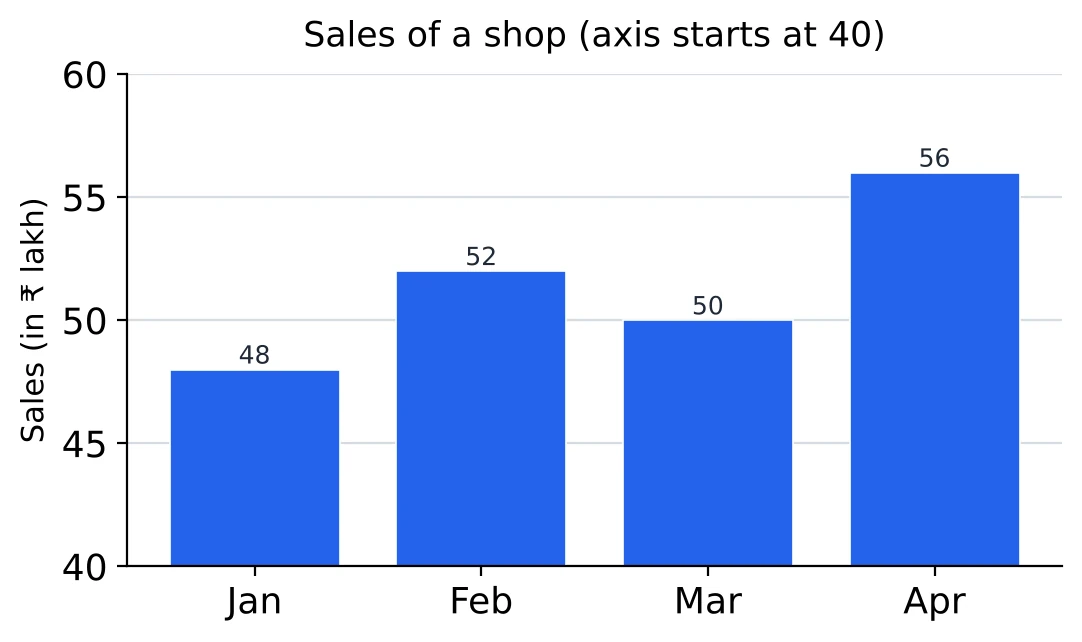
This axis starts at 40, not at 0. The April bar looks twice as tall as the January bar, yet the values are 56 and 48, and 56 is only more than 48. When the axis is cut like this, heights cannot be compared by eye; read the values and calculate.
[SSC Tip] In exam graphs without printed values, the bars end on a gridline or halfway between two. If a reading seems to fall anywhere else, read it again, because you have probably followed the wrong line across.
Percentage Change Between Two Bars
The rule is the one used for tables: the change divided by the earlier bar.
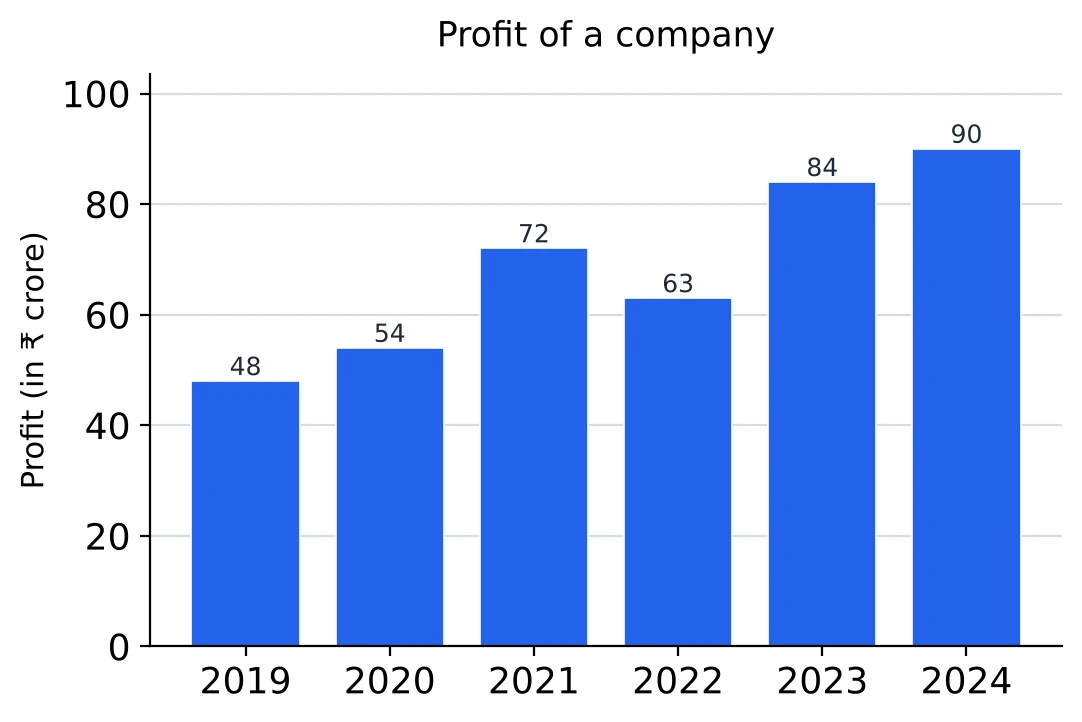
Neighbouring bars. From 2020 to 2021 the profit rose from 54 to 72: . From 2021 to 2022 it fell from 72 to 63: , a fall of 12.5%.
Bars far apart. From 2019 to 2024: , a rise of 87.5%. Only the two end bars matter; the bars in between play no part.
Which bar is the base? “By what percentage did the profit of 2022 fall compared with 2021?” uses 72 as the base. “By what percentage was the profit of 2021 more than that of 2022?” uses 63: . The difference is the same ₹ 9 crore both times, but the bases differ, so the answers differ.
From a percentage back to a bar. Questions also run the other way. If the profit in 2025 is to be 20% more than in 2024, it must be crore. Multiply by for a rise of r% and by for a fall.
Fractions for speed. 18 on 54 is , 9 on 72 is , 6 on 48 is , 21 on 63 is . Cancel to a simple fraction first and turn it into a percentage at the end; it is much quicker than dividing and then multiplying by 100 (Chapter 3 has the fraction table).
The Year with the Highest Growth
“In which year was the percentage growth over the previous year the highest?” Every pair of neighbouring bars has to be compared, so make a quick list instead of judging the steps by eye.
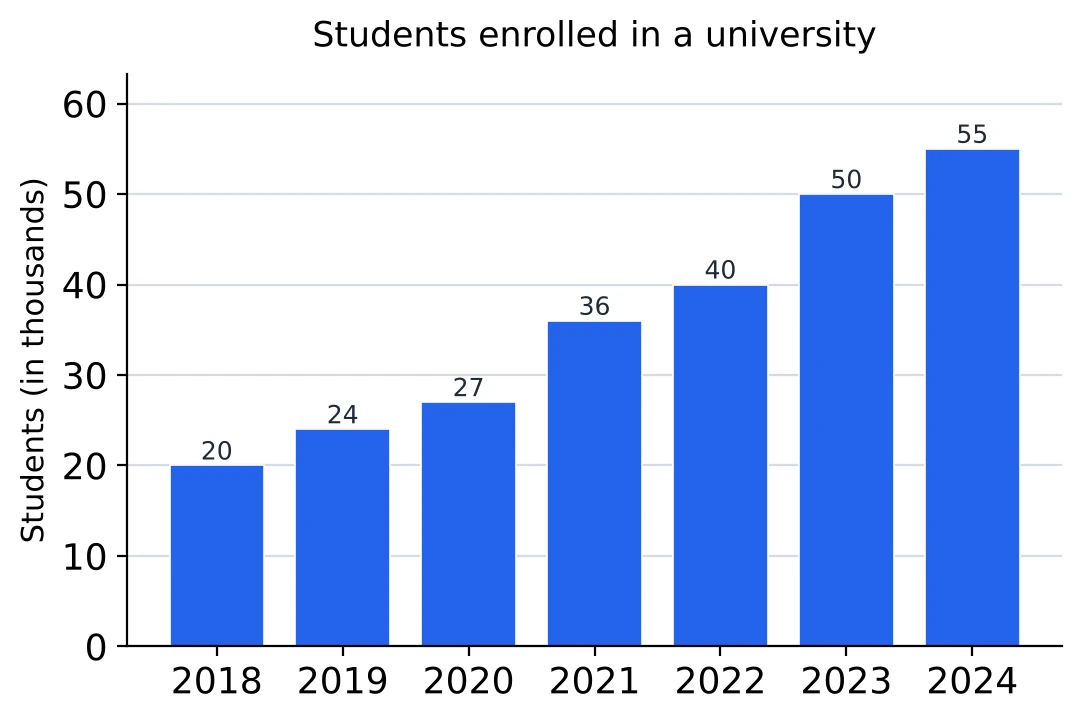
| Year | Rise | Base | Growth |
|---|---|---|---|
| 2019 | 4 | 20 | |
| 2020 | 3 | 24 | |
| 2021 | 9 | 27 | |
| 2022 | 4 | 36 | |
| 2023 | 10 | 40 | |
| 2024 | 5 | 50 |
The biggest step is not always the biggest growth. The tallest step is in 2023 (up by 10 thousand), but the highest percentage growth is in 2021 (up by 9 on a base of 27). The wording decides: “the highest increase” means the biggest step, while “the highest percentage increase” or “the highest growth rate” means the biggest fraction.
Throwing out years quickly. A rise that is no bigger, on a base that is bigger, can never win. 2022 (4 on 36) loses to 2019 (4 on 20) at once, and 2020 (3 on 24) loses too. Only the years with a large rise or a small base need a real comparison, here 2021 and 2023: against .
The lowest growth. The contest is between 2022 () and 2024 (). Cross-multiply: and . So is the larger fraction, and 2024 has the lowest growth, 10%.
When a year falls. If one bar is shorter than the one before, that year had negative growth. It is the answer to “the greatest decrease”, and it is ruled out at once for “the highest growth”.
The Ratio of Two Bars and the Average of Several Bars
Ratio of two bars. Write the two values in the order the question names them, then cancel. January to May: , dividing by 30. May to January would be .
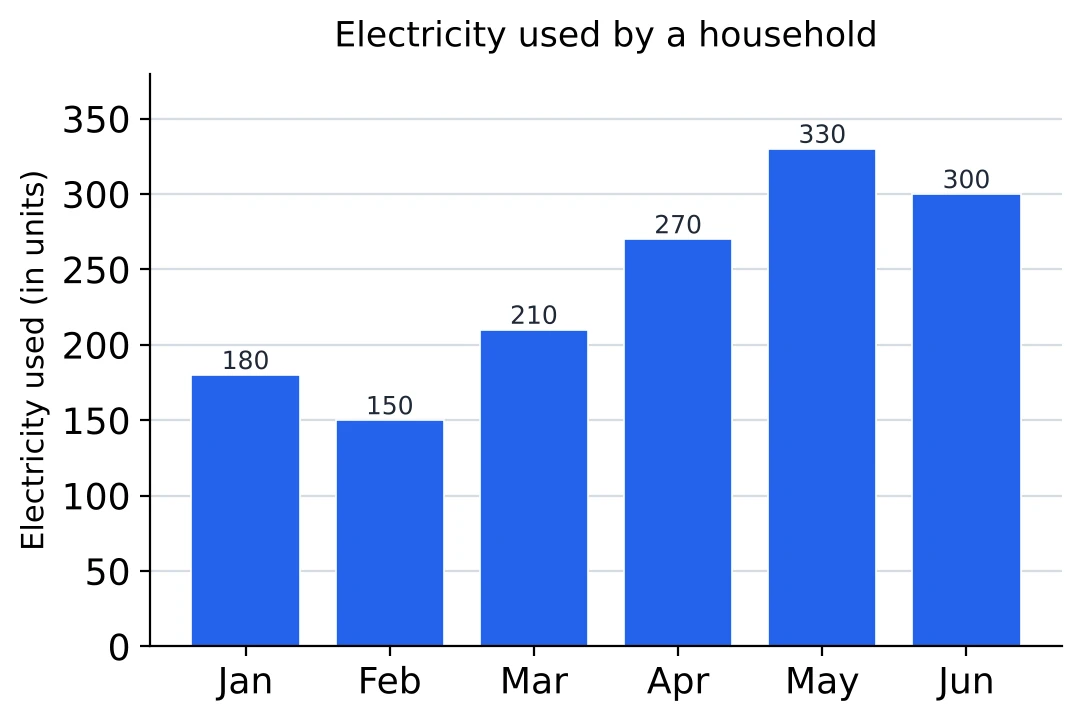
Ratio of two sums. The electricity used in the first three months against the last three: .
Average of several bars. Add the bars and divide by how many you added. All six months: units. March to May only: units.
A working mean helps here too. Guess 240. The bars differ from it by , which add up to 0, so 240 is exactly the average. Had the differences added up to , the average would have been (Chapter 5 has more on this).
Bars above the average. April, May and June are above 240; January, February and March are below it. On the graph you can picture a line across at the height of the average and count the bars that poke above it.
Average and ratio together. May's use is what percentage of the six-month average? , which is 137.5%. Any bar compared with the average works the same way, with the average as the base.
Grouped Bar Graphs: Two Series
A grouped (or multiple) bar graph stands two or more bars side by side for each category, one for each series. The legend tells you which bar is which. Here the plain bar is production and the striped one is sales, in the same order in every group.
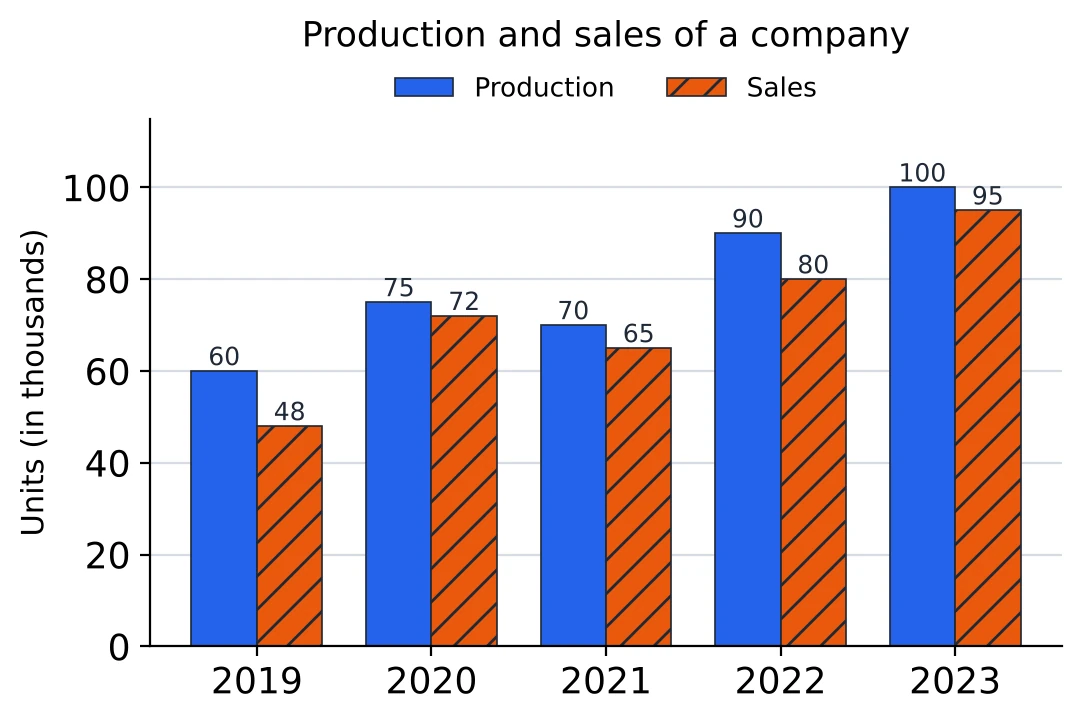
Read one series at a time. Production: 60, 75, 70, 90, 100. Sales: 48, 72, 65, 80, 95. Writing the two lists out takes ten seconds and stops you from taking the wrong bar of a pair.
Difference between the series. The units left unsold each year are production minus sales: 12, 3, 5, 10 and 5 thousand. The gap is largest in 2019, even though both bars are the shortest there.
One series as a percentage of the other. In which year were sales the largest percentage of production? 2019, ; 2020, ; 2021, ; 2022, ; 2023, . The answer is 2020. The pair of tallest bars, 2023, comes a close second.
Totals of each series. Production over the five years is thousand and sales are thousand. So sales were of production, about 91%.
Counting inside one series. In how many years did sales rise over the year before? 72 is more than 48, 65 is less than 72, 80 is more than 65 and 95 is more than 80: three years (2020, 2022 and 2023). Only the sales bars count; the production bars play no part in this question.
Grouped Bar Graphs: Three Series
With three series the groups are crowded, so the legend and the pattern on each bar matter more. Before reading anything, match each series to its place in the group. Here model X is the first (plain) bar, model Y the second (striped) and model Z the third (dotted).
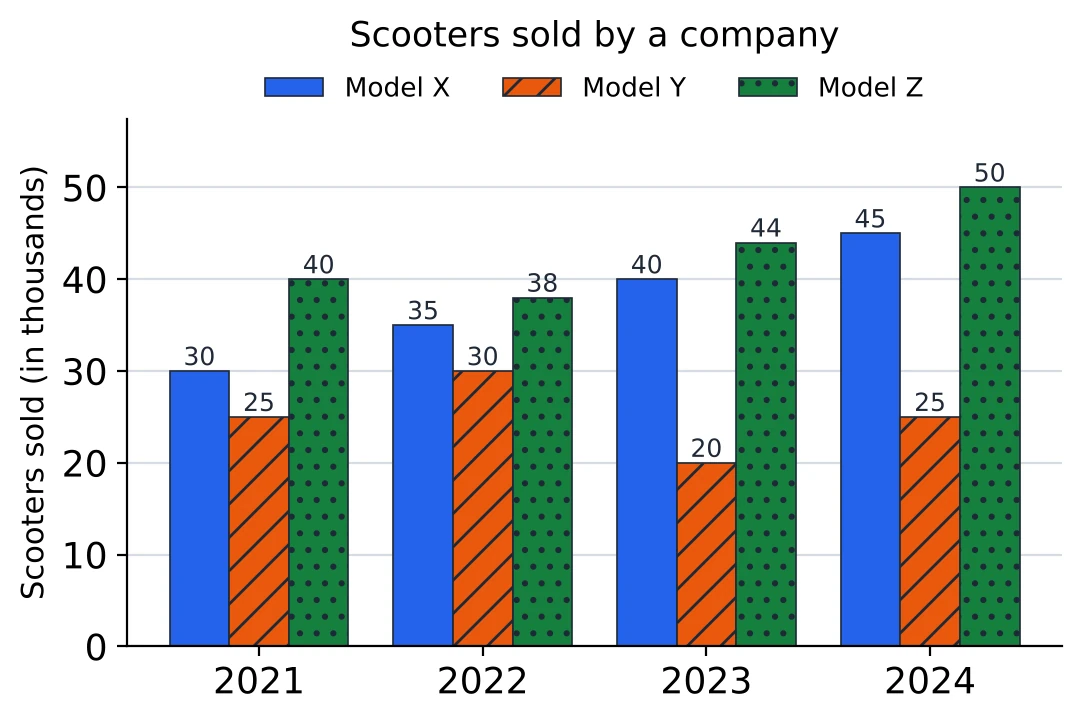
Total for each year. Add the three bars of a group: 2021, ; 2022, 103; 2023, 104; 2024, 120 thousand. The total grew every year, even though model Y fell in 2023.
Total for each series. Add the same bar across all the groups: X, 150; Y, 100; Z, 172 thousand. Model Z sold the most over the four years.
Share of a series in one year. What percentage of the scooters sold in 2024 were model X? . The base is the total of that year's group, not the total of the series.
Average of a series. Model Y averaged thousand a year.
Two series in one year. In 2023, model X sold 40 thousand and model Y 20 thousand, so X sold more than Y. Questions of this kind are taken up under the next heading.
Which series grew the most? From 2021 to 2024, X grew from 30 to 45 (50%), Y ended where it began (25), and Z grew from 40 to 50 (25%). X grew the most both in number and in percentage. Questions can ask for either, and they need not have the same answer, so read which one is wanted.
By What Percentage Is A More Than B?
The difference on top is the same in both; only the base changes, and the base is the value that comes after “than”.
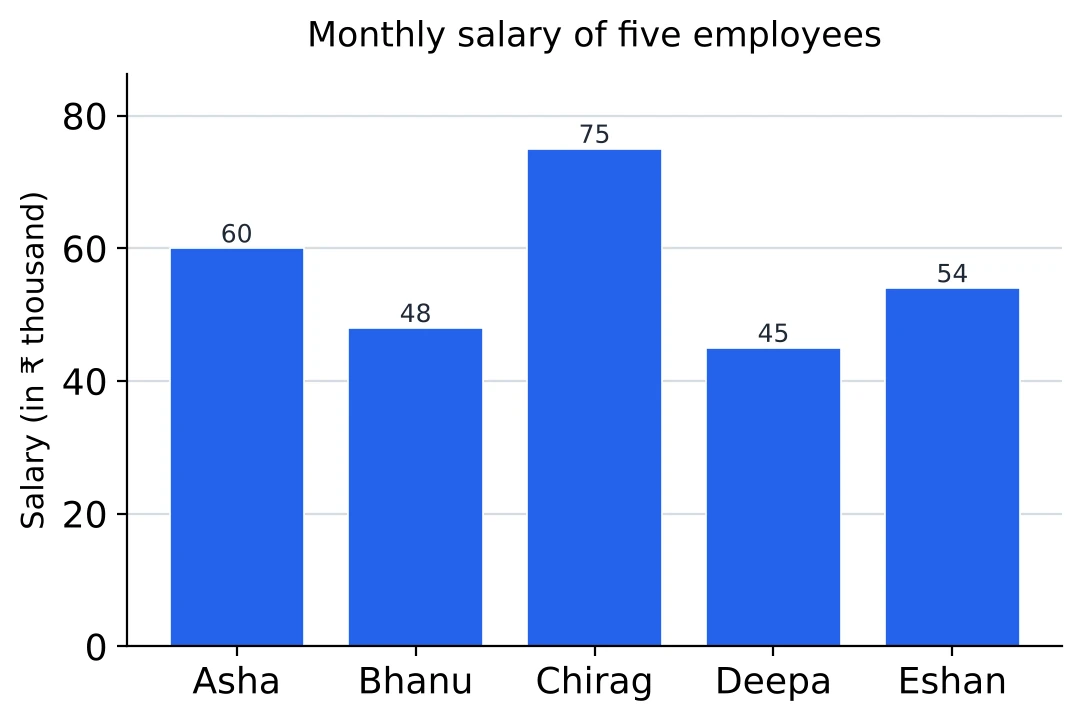
More than. Chirag earns ₹ 75 thousand and Asha ₹ 60 thousand. Chirag earns more than Asha.
Less than. Asha earns less than Chirag. The same 15 thousand, a different base, a different answer.
Pairs to know. If A is r% more than B, then B is less than A by :
| A is more than B by | B is less than A by |
|---|---|
| 25% | 20% |
| 25% | |
| 50% | |
| 100% | 50% |
Asha earns more than Deepa, so Deepa earns 25% less than Asha, with no second division.
“Of” and “more than”. Chirag's salary is of Deepa's, which makes it more than Deepa's. “A is of B” and “A is more than B” say the same thing, and the two figures always differ by exactly 100. A question asking “more than” wants the smaller one.
Inside a grouped graph. The rule is the same within a group: “In 2022, by what percentage were the exports more than the imports?” takes that year's imports bar as the base (Chapter 3 covers percentage comparison in full).
Stacked (Component) Bar Graphs
In a stacked bar graph each bar is a total cut into parts. The parts are piled one on top of another, and the legend says which shade is which part. The height of the whole bar is the total; the length of one piece is that part.
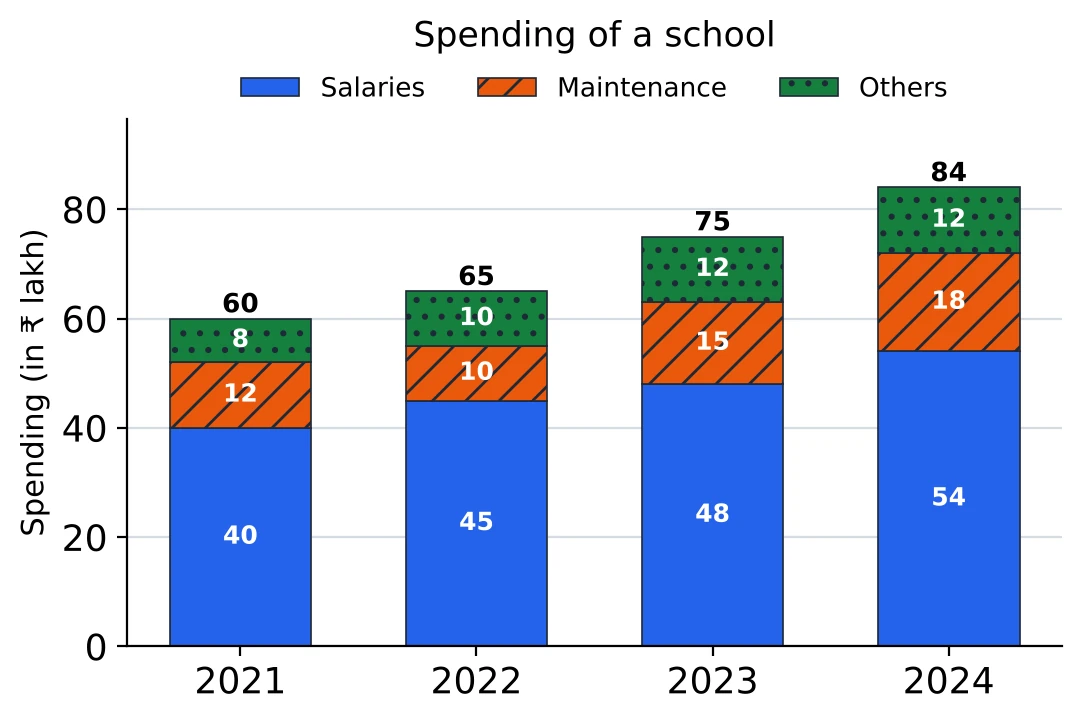
Here the value of each piece is printed inside it and the total above the bar. In 2023 the school spent ₹ 48 lakh on salaries, ₹ 15 lakh on maintenance and ₹ 12 lakh on other items, ₹ 75 lakh in all.
Share of a part. Salaries in 2023 were of the spending.
A part against the total. From 2021 to 2024 the total rose from 60 to 84, by . Maintenance rose from 12 to 18, by 50%, faster than the total; salaries rose from 40 to 54, by 35%, slower. A part can grow faster or slower than the whole, so check which one the question names.
Comparing one part across bars. Only the bottom piece stands on the axis. The pieces above it start at different heights in different bars, so compare their values (or their lengths), never the heights of their tops. The top of the Others piece in 2024 is at 84, but Others is only 12.
One part against another. Maintenance was what percentage of salaries in 2024? . The base is the part named after “of”, not the whole bar.
Stacked Bars Without Printed Values
When a stacked graph prints no values, every piece is read as the difference of two readings: where it ends minus where it starts.
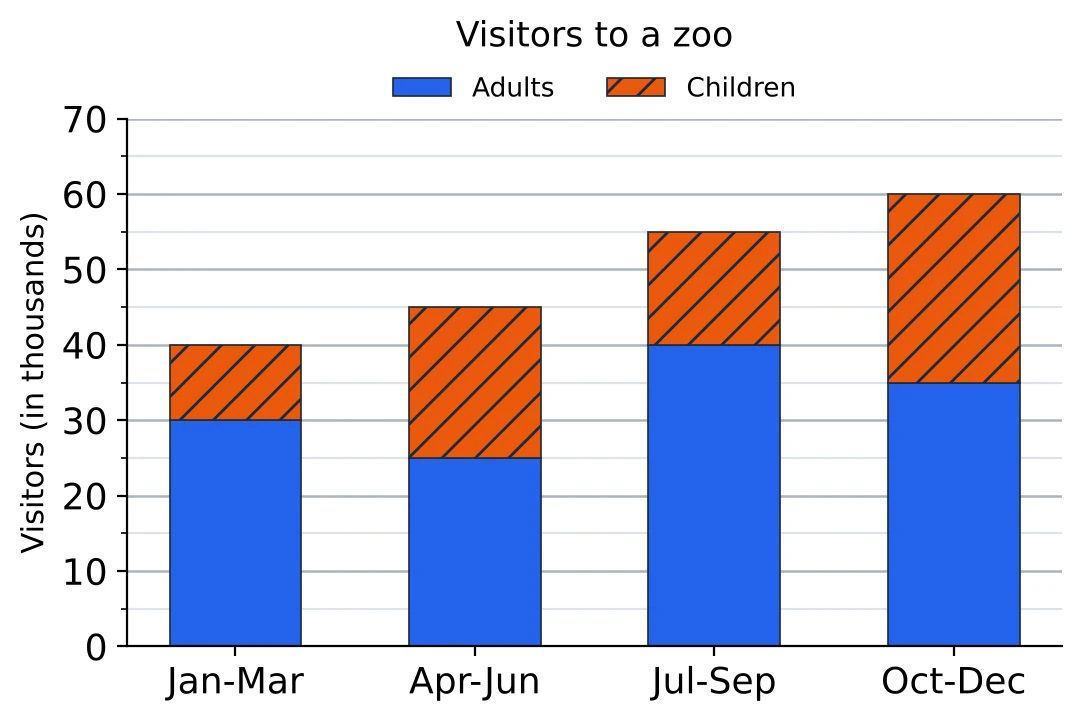
The bottom piece starts at 0, so its top gives its value. The Adults piece for January-March reaches the 30 line: 30 thousand adults.
A piece higher up starts where the one below it ends. In April-June the Children piece starts at 25 and ends at 45, so there were thousand children. Reading 45 as the number of children is the mistake to avoid; 45 is the total for that quarter.
All four bars read this way:
| Quarter | Adults | Children | Total |
|---|---|---|---|
| Jan-Mar | 30 | 10 | 40 |
| Apr-Jun | 25 | 20 | 45 |
| Jul-Sep | 40 | 15 | 55 |
| Oct-Dec | 35 | 25 | 60 |
Totals come free. The top of each bar is the total, with no adding needed. Visitors rose from 40 thousand in the first quarter to 60 thousand in the last, a rise of .
Percentage bars. Some stacked graphs make every bar 100% tall, with the pieces showing percentages. Such a graph says nothing about the size of the totals, so two equal pieces in different bars may stand for very different numbers. If the totals are given separately, multiply each percentage by its own total before comparing; it is the same care that two pie charts with different totals need (see Pie Charts).
[SSC Tip] Make a small table like the one above before you answer. Once the readings are written down, the questions on a stacked graph become table questions, and the subtraction for each piece is done only once.
Solved Examples
Question 1
The bar graph shows the number of laptops (in hundreds) sold by a shop from 2018 to 2024.
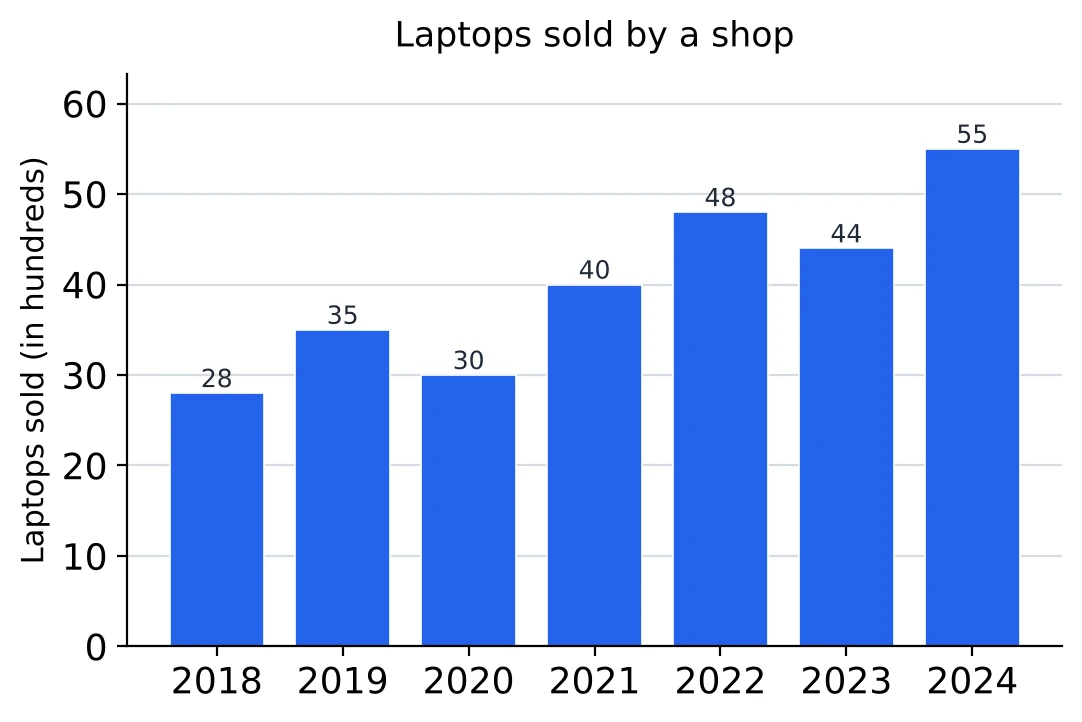
What is the ratio of the laptops sold in 2018 to those sold in 2022? (a) 12 : 7 (b) 7 : 12 (c) 4 : 5 (d) 5 : 8
Answer. The 2018 bar is 28 and the 2022 bar is 48. Both divide by 4, so , which is (b) 7 : 12. 2018 comes first in the question, so its bar goes first.
Question 2
What was the average number of laptops sold per year over the seven years? (a) 40 (b) 3,500 (c) 4,500 (d) 4,000
Answer. The seven bars add up to hundred. Divided by 7 that is 40 hundred, so the average is (d) 4,000 laptops. The bars are in hundreds, which is why 40 on its own is too small.
Question 3
In which year was the percentage increase in sales over the previous year the highest? (a) 2021 (b) 2024 (c) 2022 (d) 2019
Answer. Sales rose in 2019 (28 to 35), 2021 (30 to 40), 2022 (40 to 48) and 2024 (44 to 55). The rises are 7, 10, 8 and 11, but the bases matter more: , , and . The largest is , about 33%, so the answer is (a) 2021. 2024 has the biggest step, but on a bigger base.
Question 4
The bar graph shows the number of seats in six engineering colleges, A to F.
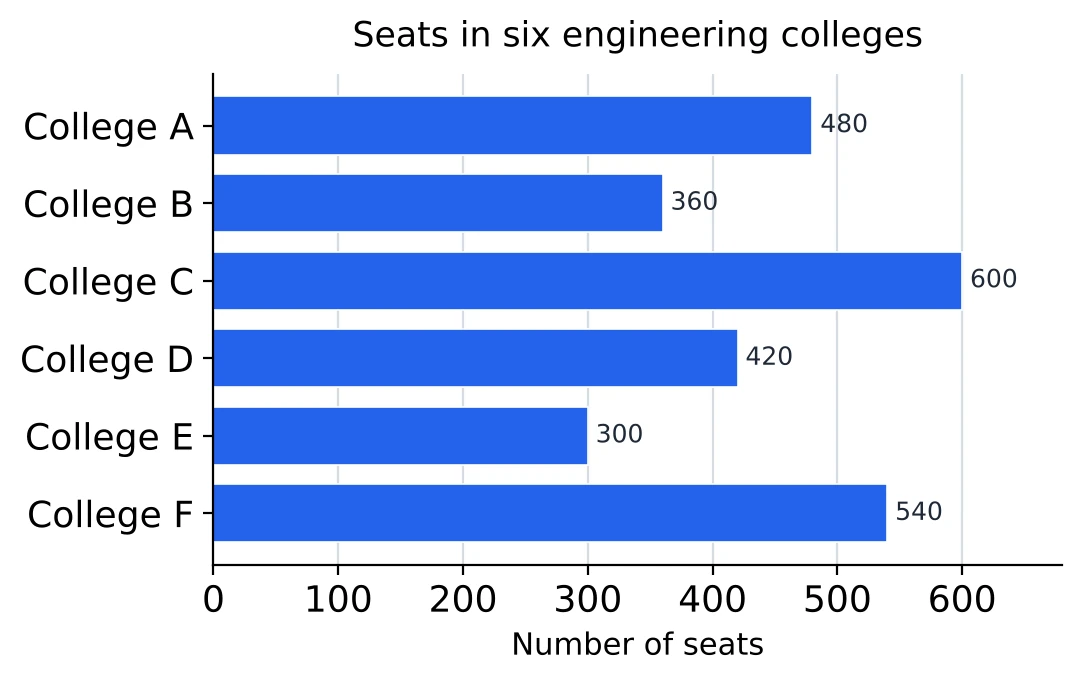
By what percentage are the seats in college C more than the seats in college B? (a) 40% (b) 60% (c) (d)
Answer. C has 600 seats and B has 360, a difference of 240. “More than B” makes B the base: , which is (c) . With C as the base I would get 40%, and that answers “by what percentage are B's seats less than C's”.
Question 5
What percentage of the seats in the six colleges are in college F? (a) 20% (b) 18% (c) 25% (d)
Answer. All six bars: . F has 540, and , so the answer is (a) 20%.
Question 6
How many colleges have more seats than the average number of seats per college? (a) 2 (b) 3 (c) 4 (d) 5
Answer. The average is (the total is from the last question). A (480), C (600) and F (540) are above it. D (420) is close but below. So (b) 3 colleges.
Question 7
The bar graph shows the milk (in thousand litres) collected by a dairy on six days of a week. Read the values from the scale.
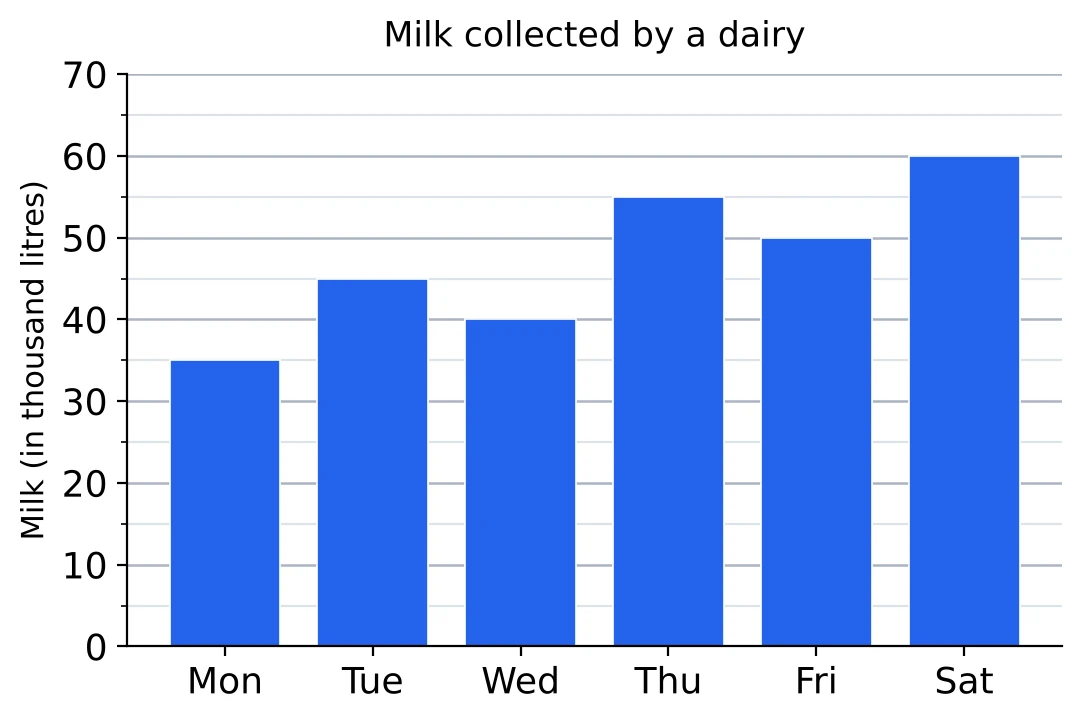
How much milk did the dairy collect in the six days together? (a) 2,80,000 litres (b) 2,90,000 litres (c) 2,85,000 litres (d) 28,500 litres
Answer. The faint lines are 5 apart. Reading each bar: Monday 35, Tuesday 45, Wednesday 40, Thursday 55, Friday 50, Saturday 60. Total: thousand litres, which is (c) 2,85,000 litres. If one bar is read off by a faint line, the total moves by 5 thousand, so I check each reading before adding.
Question 8
By what percentage was the milk collected on Thursday more than that collected on Wednesday? (a) (b) 15% (c) 25% (d) 37.5%
Answer. Thursday reads 55 and Wednesday 40. More by 15 on a base of 40: , and is 37.5%. The answer is (d) 37.5%.
Question 9
What is the ratio of the milk collected on Monday to that collected on Saturday? (a) 7 : 12 (b) 12 : 7 (c) 1 : 2 (d) 2 : 3
Answer. Monday's bar stops halfway between 30 and 40, so it is 35; Saturday's is on the 60 line. Dividing by 5, , so (a) 7 : 12.
Question 10
The bar graph shows the number of boys and girls of a school who appeared in an examination from 2020 to 2024.
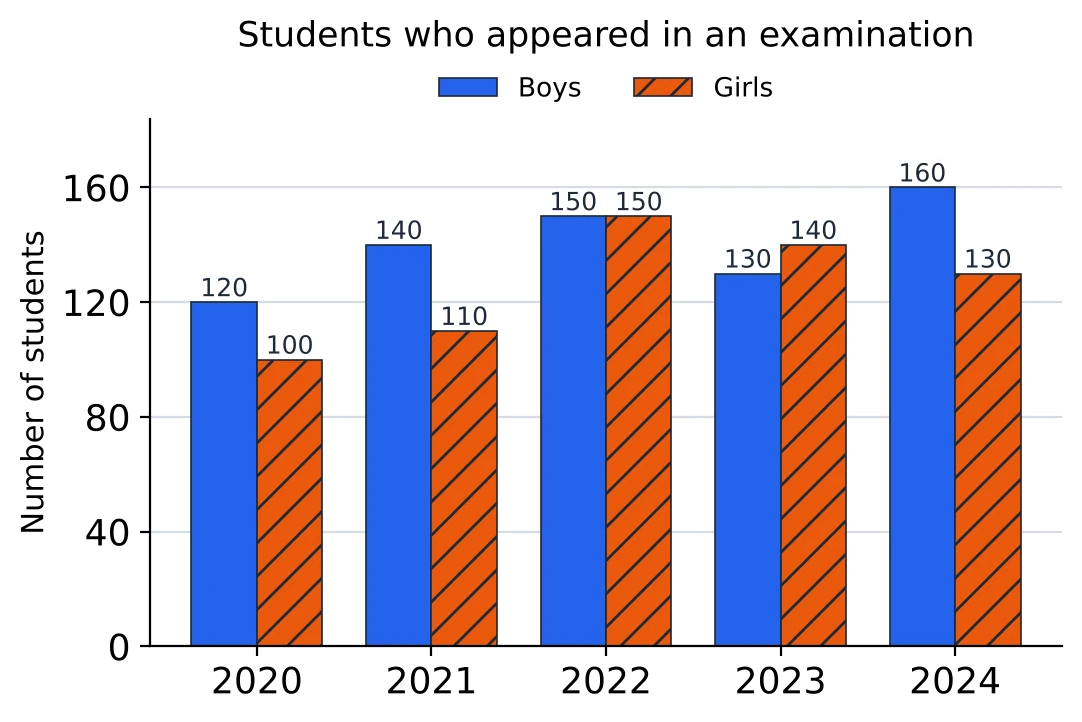
In which year was the ratio of boys to girls the highest? (a) 2020 (b) 2021 (c) 2024 (d) 2022
Answer. Boys divided by girls each year: 2020, ; 2021, ; 2022, exactly 1; 2023, less than 1; 2024, . The highest is (b) 2021. 2024 has the most boys, but there are many girls that year too.
Question 11
The total number of girls over the five years is what percentage of the total number of boys? (a) (b) 80% (c) 90% (d) 95%
Answer. Girls: . Boys: . The boys are the base: , which is (c) 90%.
Question 12
In how many years were there fewer girls than boys? (a) 4 (b) 2 (c) 1 (d) 3
Answer. The girls' bar is shorter in 2020, 2021 and 2024. In 2022 the two bars are equal (150 each), and in 2023 the girls are more. That makes (d) 3 years.
Question 13
The bar graph shows the production of wheat, rice and pulses (in lakh tonnes) in a state from 2021 to 2024.
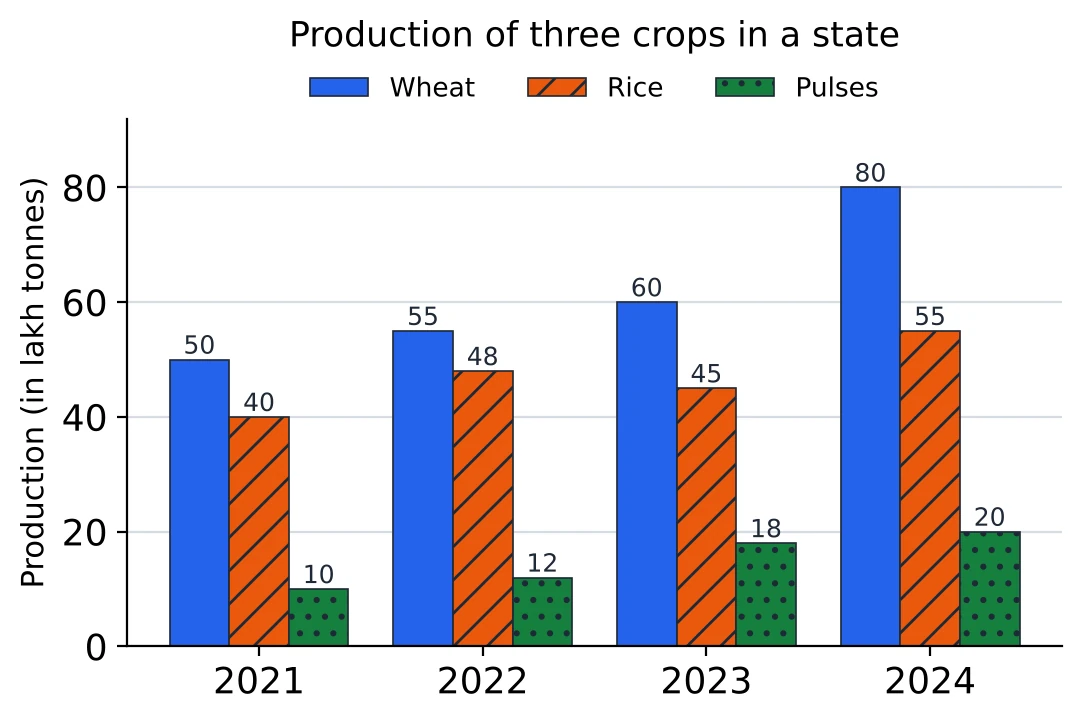
By what percentage did the total production of the three crops rise from 2021 to 2023? (a) 23% (b) 20% (c) 12.5% (d) 80%
Answer. 2021: . 2023: . A rise of 23 on a base of 100 is (a) 23%. With a base of exactly 100, the rise is the percentage.
Question 14
What was the average production of rice per year over the four years? (a) 45 lakh tonnes (b) lakh tonnes (c) 47 lakh tonnes (d) 48 lakh tonnes
Answer. The rice bars are the middle bars of each group: 40, 48, 45 and 55. They add up to 188, and , so the answer is (c) 47 lakh tonnes.
Question 15
In 2024, the production of pulses was what percentage of the production of wheat? (a) 400% (b) (c) 20% (d) 25%
Answer. In 2024 pulses are 20 and wheat is 80, and wheat is the base: , which is (d) 25%.
Question 16
The bar graph shows the exports and imports of a company (in ₹ crore) from 2020 to 2024.
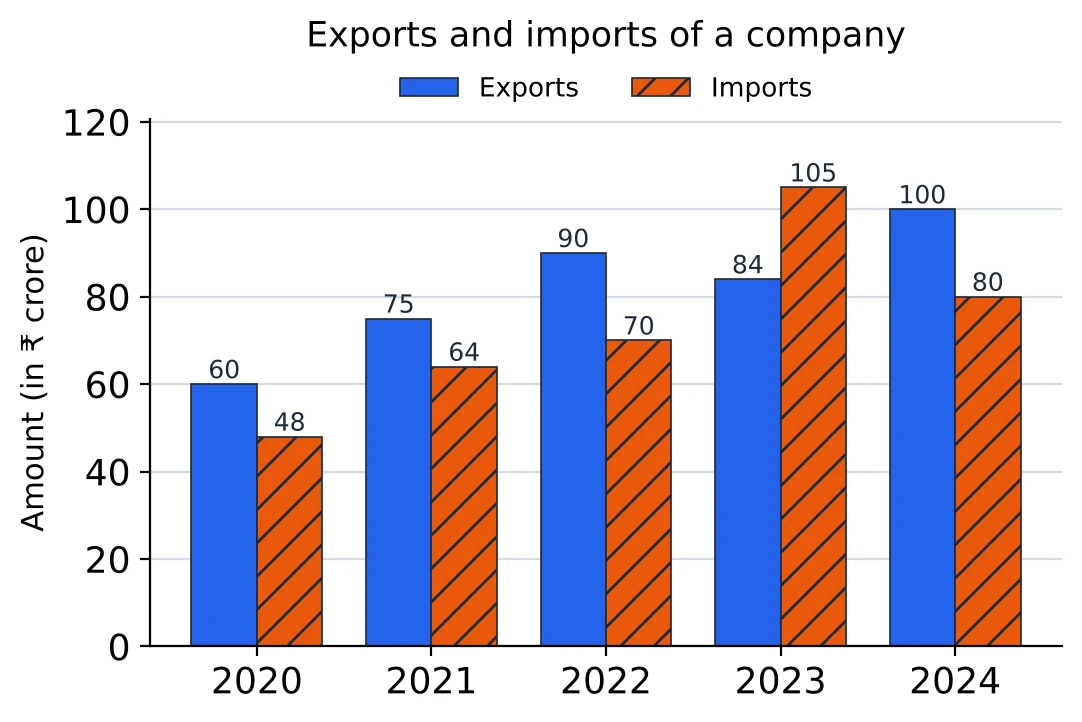
In 2023, by what percentage were the imports more than the exports? (a) 20% (b) 25% (c) 21% (d)
Answer. In 2023 imports were 105 and exports 84, a gap of 21. “More than the exports” puts the exports at the bottom: , so the answer is (b) 25%.
Question 17
In 2023, by what percentage were the exports less than the imports? (a) 20% (b) 25% (c) 21% (d)
Answer. The gap is the same 21, but now the base is the imports, 105: , which is (a) 20%. This and the last question look at one gap from its two ends, which is why the answers differ.
Question 18
In how many years were the exports at least 25% more than the imports? (a) 2 (b) 4 (c) 3 (d) 1
Answer. At least 25% more than the imports means at least times the imports. 2020: , exactly the exports, so it counts. 2021: , more than 75, so no. 2022: , and 90 is above it. 2023: the imports are bigger. 2024: , equal again. That makes (c) 3 years: 2020, 2022 and 2024. With “more than 25%” in place of “at least 25%”, the two equal years would drop out.
Question 19
The stacked bar graph shows the number of students (in hundreds) in the three faculties of a university from 2021 to 2024.
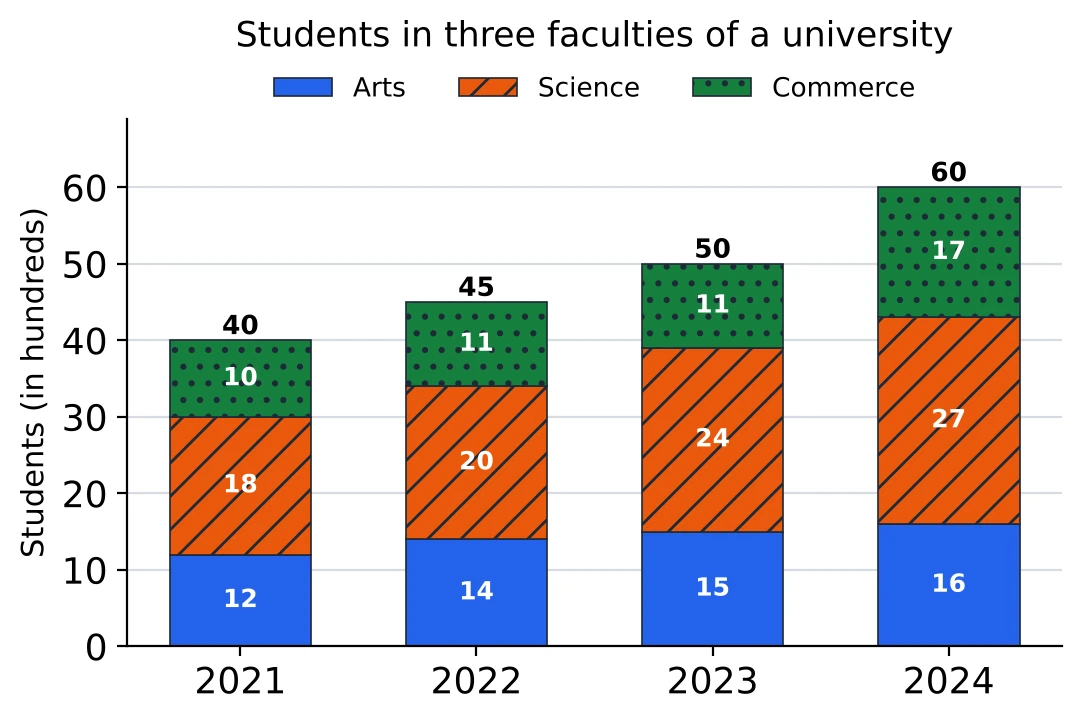
How many students were there in the university in 2023? (a) 50 (b) 2,400 (c) 4,500 (d) 5,000
Answer. The whole 2023 bar reaches 50 (the total printed on top, and checks it). The unit is hundreds, so there were (d) 5,000 students.
Question 20
What percentage of the students in 2024 were in the Science faculty? (a) 27% (b) 45% (c) 40% (d) 50%
Answer. The 2024 total is 60 and the Science piece is 27. , which is (b) 45%. The 27 is a number of students (in hundreds), not a percentage, so it can't be read off as the answer.
Question 21
In which year was the share of Arts students in the university's total the highest? (a) 2022 (b) 2024 (c) 2021 (d) 2023
Answer. Arts as a fraction of each year's total: 2021, ; 2022, ; 2023, ; 2024, . The share is highest in (a) 2022, even though the Arts piece is biggest in 2024, where the total grew faster.
Question 22
The stacked bar graph shows the sales (in ₹ lakh) of two products, P and Q, of a company from 2020 to 2023. Read the values from the scale.
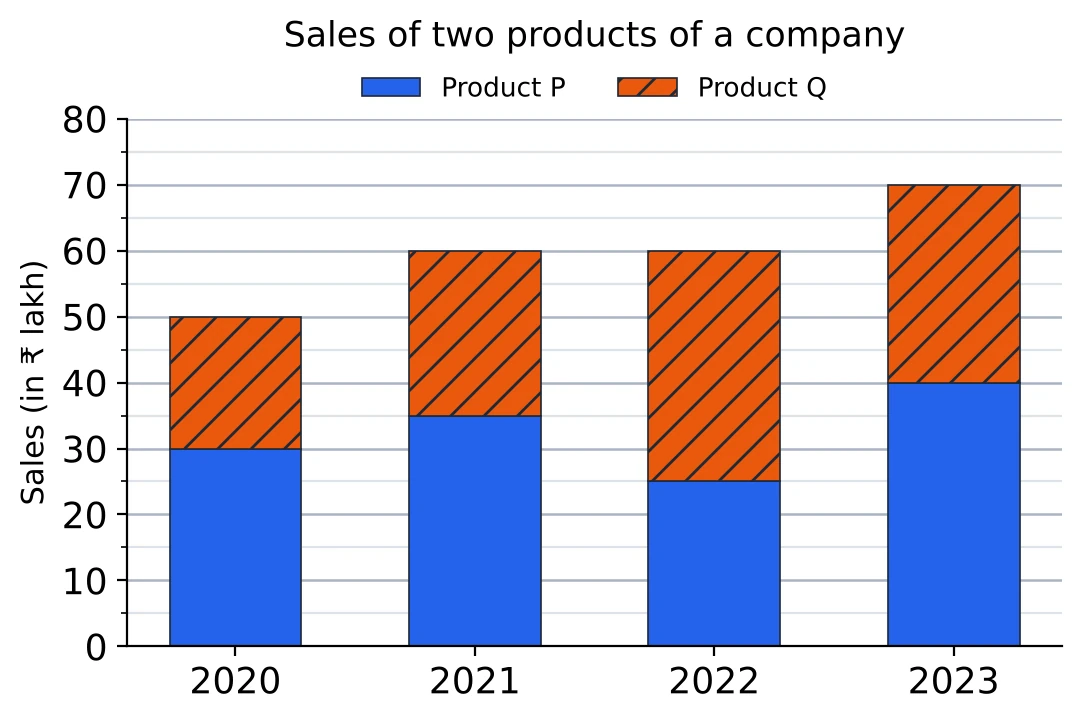
What were the sales of product Q in 2022? (a) ₹ 60 lakh (b) ₹ 25 lakh (c) ₹ 35 lakh (d) ₹ 30 lakh
Answer. In 2022 the P piece at the bottom ends at 25, and the Q piece on top of it ends at 60. So Q's sales are , which is (c) ₹ 35 lakh. The 60 is the top of the whole bar, the sales of both products together.
Question 23
By what percentage did the total sales of the two products rise from 2020 to 2023? (a) (b) 20% (c) 50% (d) 40%
Answer. The tops of the bars are the totals: 50 in 2020 and 70 in 2023. A rise of 20 on a base of 50 is , that is (d) 40%.