
Read the Question Before the Chart
A DI set is one table or chart followed by two to four questions, and the arithmetic in it is plain percentages, ratios and averages. Time is lost in two ways: reading every number on the chart when a question needs only two or three, and doing long division where a known fraction would do. Each method below saves one of these, and some of them say where they stop working.
Fast way: read the question first, then go to the chart for only the values it needs, and write each one down with its unit. In the table below, a question on two cells needs two readings, not twenty.
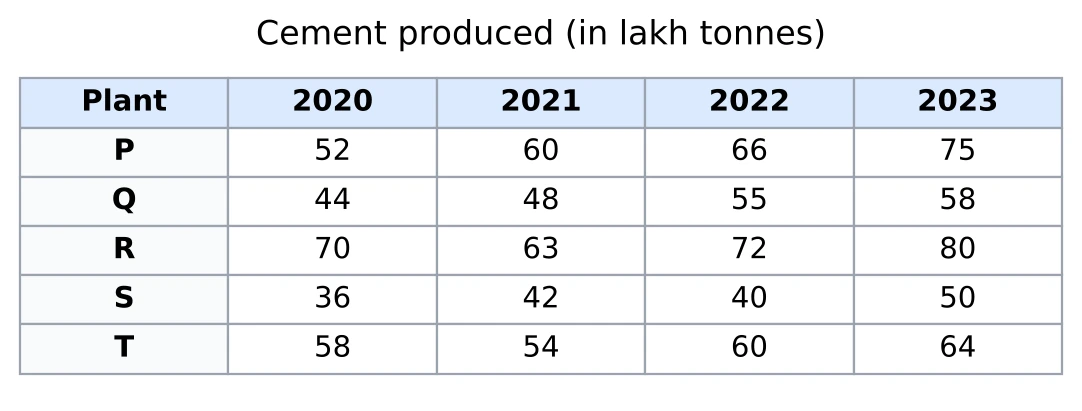
For example: what is the ratio of plant Q's production in 2021 to plant T's production in 2023? Only two cells matter, 48 and 64, and the ratio is .
Watch the units: the title says 'in lakh tonnes', so 48 means 48 lakh tonnes. If the options are in tonnes, convert before you choose.
Percentages as Fractions
A percentage question is a fraction first. Write the part over the whole and cancel. If the fraction is one of these, the percentage is known at once.
| Fraction | Percent | Fraction | Percent |
|---|---|---|---|
| 33.33% | 11.11% | ||
| 25% | 9.09% | ||
| 16.67% | 8.33% | ||
| 14.29% | 6.67% | ||
| 12.5% | 6.25% |
Multiples follow from these: , , and . A longer list is in Chapter 3.
For example: 156 out of 1,248 is . Since , this is , or 12.5%. The other way round, 37.5% of ₹ 4,800 is of 4,800, which is ₹ 1,800.
Percentage Change as a Fraction, or as a Multiplier
Put the change over the earlier value and cancel it to a fraction from the table above. When the two values are far apart, or the change is awkward, divide the new value by the old one instead and read the multiplier:
- is a rise of 25%, a rise of 12.5% and a rise of 150%;
- is a fall of 20% and a fall of 10%.
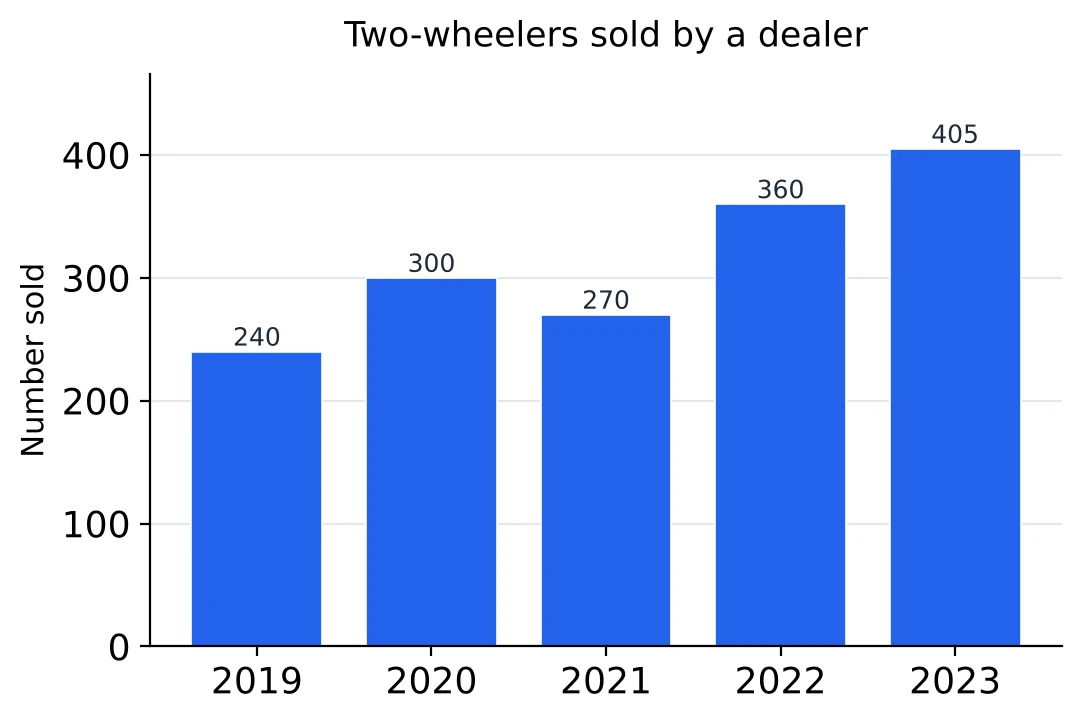
For example: from 2019 to 2020 the rise is 60 on 240, a quarter, so 25%. From 2020 to 2021 the multiplier is , a fall of 10%. From 2019 to 2023 it is , so the rise is .
Where it fails: the change must go over the earlier value. Putting the 2019 to 2020 rise of 60 over 300 gives 20%, which answers a different question.
Degrees to Percentages: Count in Steps of
A slice of is 5% of the pie, so count how many 18s an angle holds and multiply by 5. A half step, , is 2.5%. Going the other way, every 5% is , so 35% is . The rule behind this, , is in Pie Charts.
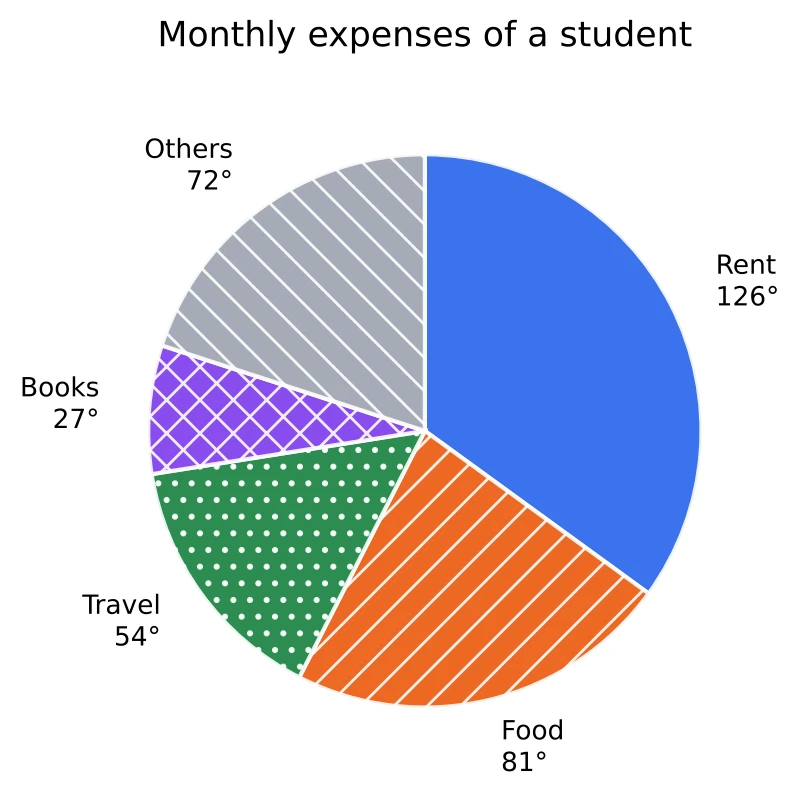
For example: Rent is , seven steps, so 35%. Food is , four and a half steps, so 22.5%. Books, , is one and a half steps, so 7.5%. All five shares, , add up to 100, which also checks the reading.
Where it fails: an angle that is not a multiple of , such as , needs the division: , so about 13.89%.
How Much Rounding the Options Allow
Fast way: before rounding, see how far apart the options are compared with the answer itself. If neighbouring options differ by a fifth or a quarter of the answer, a rounding error of 2% or 3% cannot change your choice. And if the top and the bottom of a fraction are both rounded down (or both up) by about the same percentage, the errors cancel and the answer hardly moves.
For example: 4,870 is what percent of 24,310, with options 15%, 20%, 25% and 30%? The options are 5 points apart, a quarter of 20, so there is room to round. 4,800 and 24,000 are both between 1.2% and 1.5% below the true numbers, so is very close. The true value is 20.03%.
Where it fails: with options 19.6%, 20%, 20.4% and 20.8%, neighbours differ by only 2% of the answer. Rounding cannot separate them, so divide properly.
Compare Ratios Without Dividing
Fast way: is bigger than when . With several years to compare, first drop the ones that fall below an easy benchmark such as 1 or 1.5, then cross-multiply only the ones left.
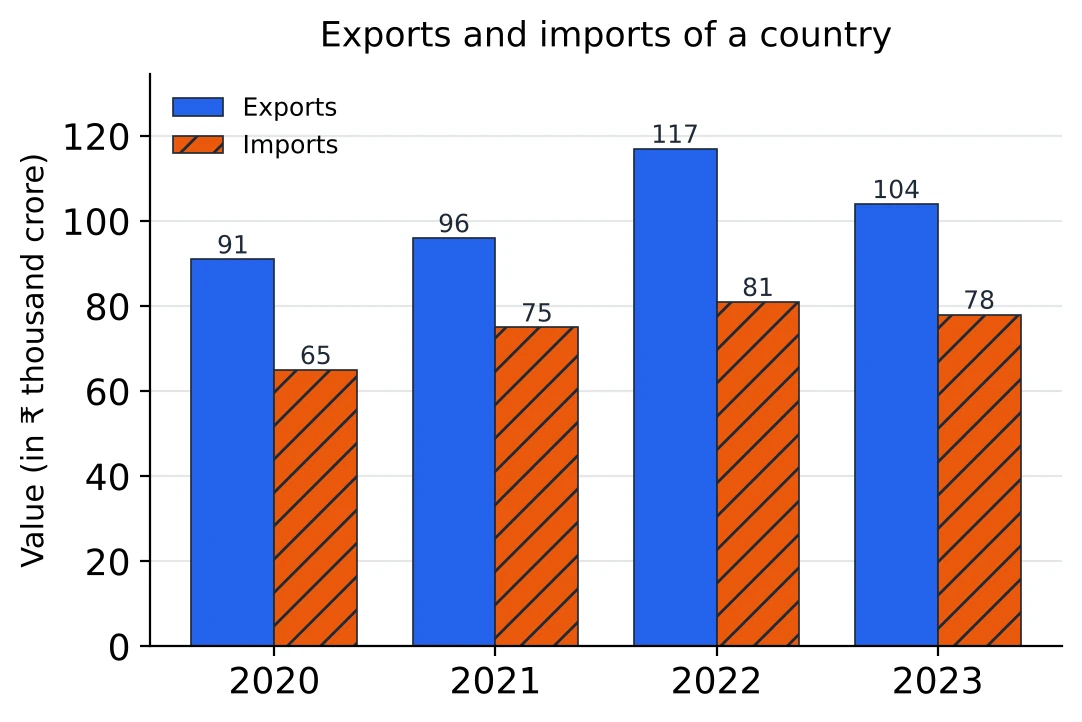
For example: in which year was the ratio of exports to imports the highest? Exports beat imports every year, so 1 is no use as a benchmark; try 1.4. 2020 is exactly 1.4, because . 2021 and 2023 fall short, because and are more than their exports of 96 and 104. That leaves 2020 and 2022: and , so 2022 has the higher ratio.
Average by Deviations from a Guess
Pick a round number near the middle of the values. Write how far each value is above it (plus) or below it (minus), add these deviations, divide by the number of values, and add the result to your guess.
For example: a town's rainfall in six months was 238, 252, 245, 261, 229 and 251 mm. From a guess of 250 the deviations are and , which add up to . So the average is mm.
The total then comes free: six months at an average of 246 mm make mm, with no long addition.
Adding a Row by Grouping
Before adding a row or a column, look for pairs that make round numbers. Add the pairs first, then the rest. When both row totals and column totals are asked for, the grand total from the rows must equal the grand total from the columns, which checks both at no extra cost.
For example: for , pair and . The total is .
Decimals group the same way. A column of 2.75, 3.4, 1.25 and 4.6 (in ₹ crore) gives and , so it adds up to ₹ 12 crore.
The Biggest Percentage Rise: Test Against a Benchmark
Fast way: instead of dividing each rise by its base, ask a yes-or-no question: is the rise more than a quarter of the base? Multiply the base by the benchmark, compare, and keep only the years that pass. Then raise the benchmark (to a third, say) for the years left.
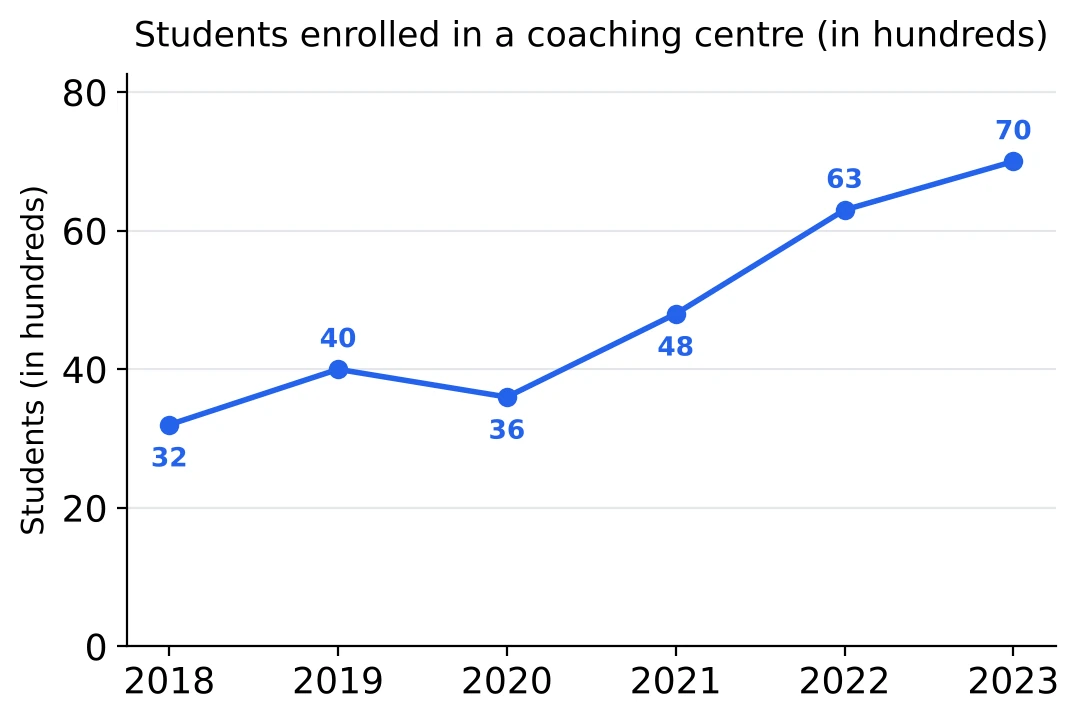
For example: which year had the greatest percentage rise? Against a quarter: 2019 rose 8 on 32, exactly a quarter; 2021 rose 12 on 36, more than a quarter (9); 2022 rose 15 on 48, more than a quarter (12); 2023 rose 7 on 63, far less than a quarter; 2020 was a fall. Against a third: a third of 36 is 12, so 2021 is exactly a third, while a third of 48 is 16, more than 15. So 2021 had the greatest percentage rise, , although the steepest segment is the one from 2021 to 2022.
Growth-Rate Graphs: Multiply the Fractions
When a line graph shows the percentage increase over the previous year, each year's value is the year before times . Write each rate as a fraction and multiply: 20% is , 25% is , 10% is and a fall of 10% is . For two years together, a% and b% make percent (Chapter 3).
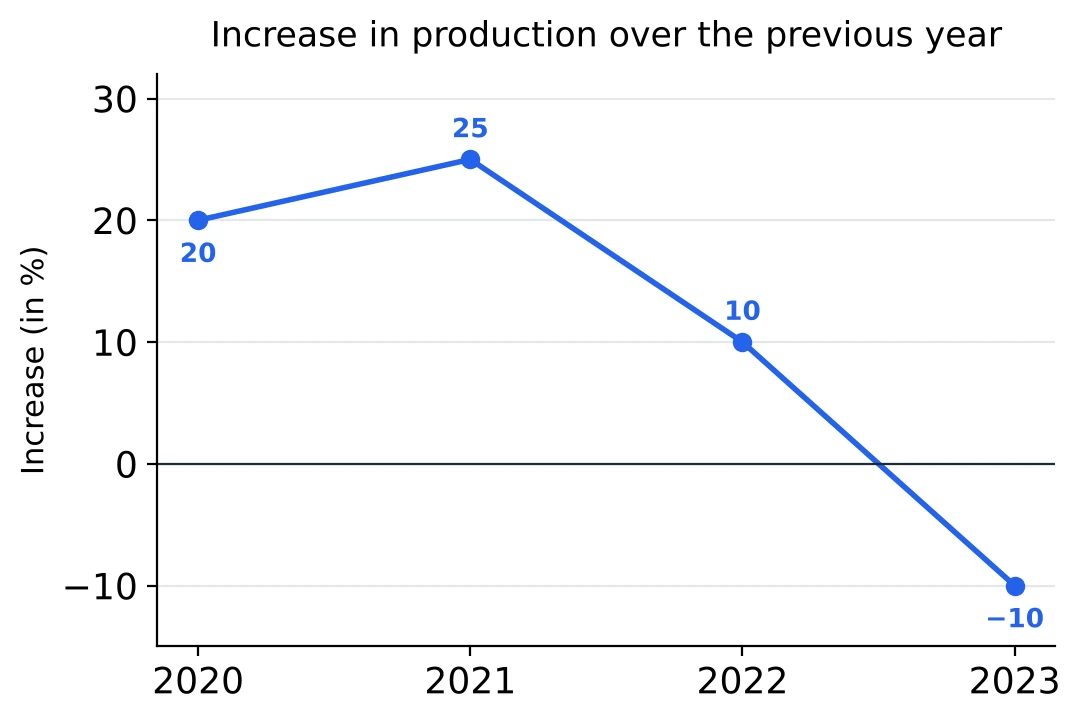
For example: a factory made 400 tonnes in 2019. In 2021 it made tonnes, a rise of over the two years. Then tonnes in 2022, though the line drops there, and tonnes in 2023, the only year with a rate below zero.
Combined Percentage by Weights
A combined percentage lies between the separate percentages, and the sizes of the groups decide where. With groups in the ratio and percentages and , it is . In words, it sits of the way from towards .
For example: in school A, 80% of 300 students passed, and in school B, 60% of 100 students passed. The groups are in the ratio 3 : 1, so the combined figure is a quarter of the way from 80 down to 60: . The plain average, 70%, would be right only for groups of equal size.
A Share of a Share: Multiply the Fractions
When one chart gives a part of the total and another gives a share of that part, multiply the two fractions and use the total only once. A ratio becomes a fraction first: boys and girls in the ratio 2 : 3 means the girls are of that group.
For example: a pie chart shows that 30% of a college's 5,000 students study Arts, and a table shows boys and girls in Arts in the ratio 2 : 3. The girls in Arts are of all the students, and .
Percentages of percentages work the same way. If 40% of a firm's staff work in Sales and 25% of the Sales staff are women, the women in Sales are of all the staff.
Throw Out Impossible Options First
Some options can be crossed out without any working, because the answer has to lie in a certain range.
- An average lies between the smallest and the largest value.
- A combined percentage lies between the separate percentages.
- A part is less than its total, and a share of a part is less than the part.
- A fall of 100% means the value has dropped to zero, so a fall in a quantity that is still there is less than 100%.
For example: the average of 238, 252, 245, 261, 229 and 251 mm must lie between 229 and 261, so options of 226 mm and 264 mm go at once. For the two schools above, 82% and 58% cannot be the combined pass percentage, because it must lie between 60% and 80%.
Solved Examples
The fifteen questions below are worked the quick way, on five charts and tables and one short word problem. Work each one on paper before reading the answer, and aim for under a minute; three of the answers say how long a quick solver takes.
Question 1
The table shows the number of cars sold by four showrooms from 2020 to 2023.
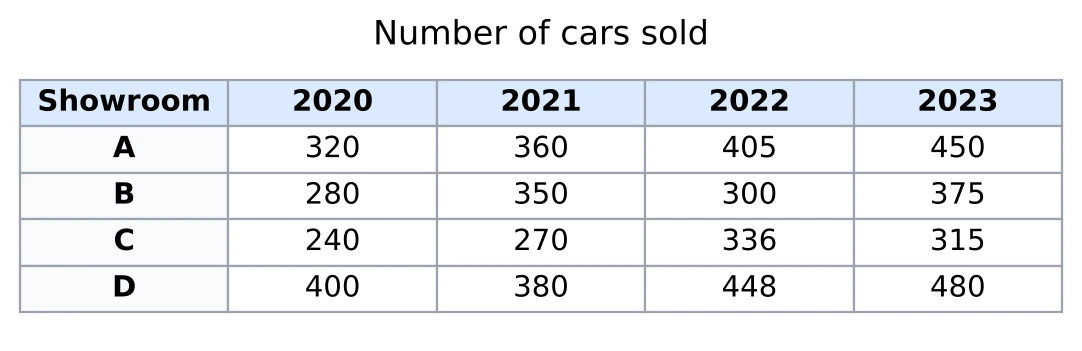
By what percentage did showroom B's sales rise from 2020 to 2021?
Answer. B sold 280 cars in 2020 and 350 in 2021, so the rise is 70. On the base of 280 that is , so sales rose by 25%.
Question 2
From the same table: in 2022, by what percentage were showroom D's sales more than showroom C's?
Answer. In 2022, D sold 448 and C sold 336. 'More than C' makes C the base: . So D sold more. Turned round, C sold less than D.
Question 3
From the same table: find the average number of cars sold per showroom in 2023.
Answer. The 2023 sales are 450, 375, 315 and 480. I take 400 as my guess. The deviations are and , which add up to . So the average is 405 cars.
Question 4
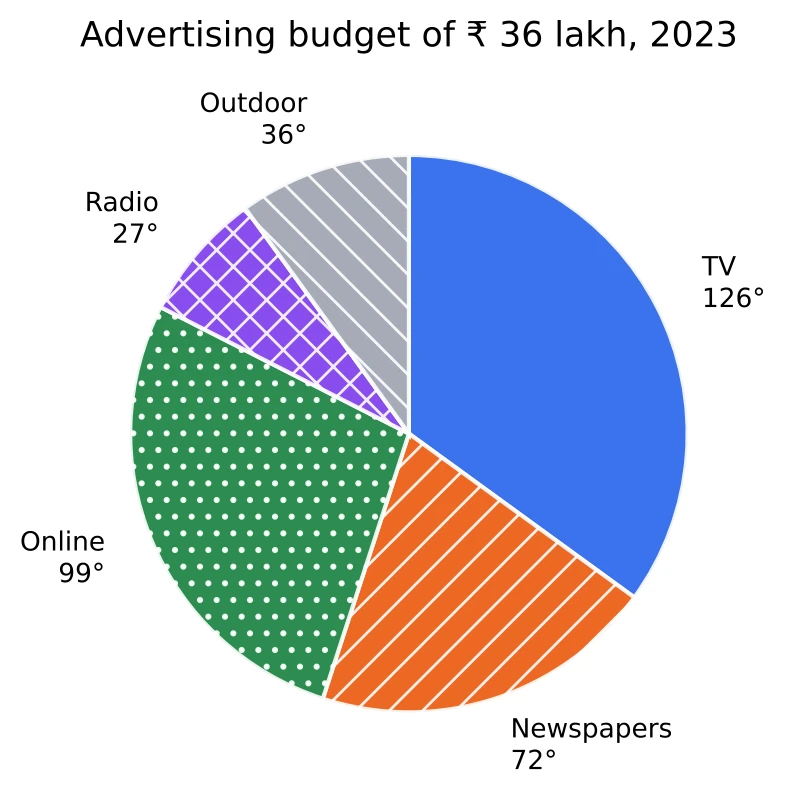
The pie chart shows how a company spent its advertising budget of ₹ 36 lakh in 2023.
How much did the company spend on online advertising?
Answer. The whole pie, , is ₹ 36 lakh, so each degree is worth ₹ 10,000. Online is , so the company spent rupees, which is ₹ 9.9 lakh.
Question 5
From the same pie chart: what percentage of the budget went on TV?
Answer. is seven steps of , and each step is 5%, so TV took 35% of the budget.
Question 6
From the same pie chart: how much more was spent on TV than on newspapers?
Answer. The angles differ by . At ₹ 10,000 a degree, that is ₹ 5.4 lakh. I never had to find the two amounts separately.
Time check: about 15 seconds.
Question 7
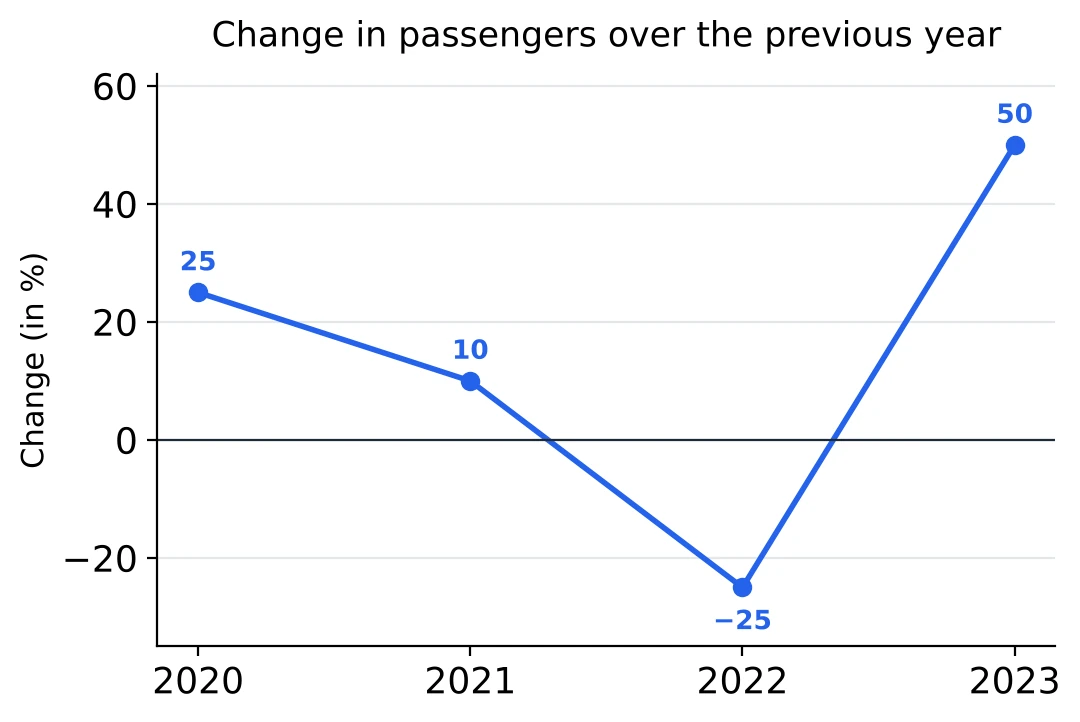
The line graph shows the percentage change in the number of passengers at a railway station over the previous year. In 2019, 64 lakh passengers used the station.
How many passengers used the station in 2021?
Answer. A 25% rise is and a 10% rise is . So 2021 had 88 lakh passengers.
Question 8
From the same graph: in how many of the years from 2020 to 2023 did the number of passengers go up compared with the year before?
Answer. The number goes up whenever the rate is above zero, whatever the line does. 2020, 2021 and 2023 have positive rates, and only 2022 is negative. So the number went up in 3 years. The line falls from 2020 to 2021, but a 10% rise is still a rise.
Question 9
From the same graph: was the number of passengers in 2023 more or less than in 2021, and by what percentage?
Answer. After 2021 there is a fall of 25% and then a rise of 50%, which is . So 2023 had 12.5% more passengers than 2021: 99 lakh against 88 lakh.
Time check: about 20 seconds.
Question 10
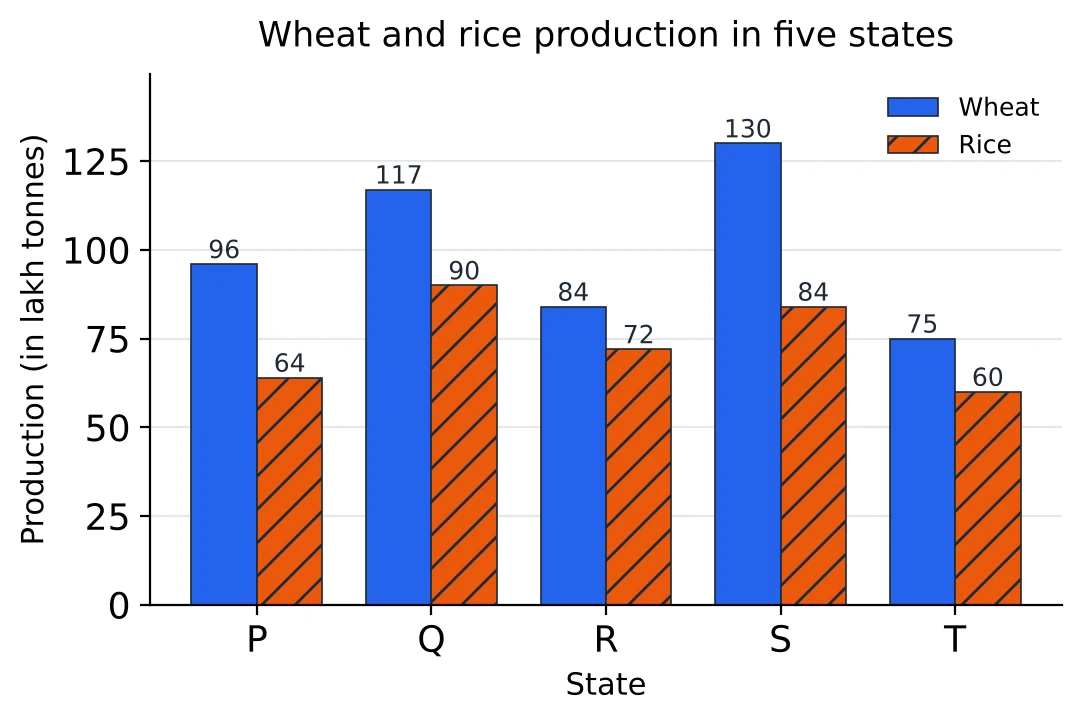
The bar graph shows the production of wheat and rice in five states (in lakh tonnes).
In which state is the ratio of wheat production to rice production the highest?
Answer. I use 1.5 as a benchmark. For P, , exactly its wheat, so P's ratio is 1.5. For Q, R and T, 1.5 times the rice is 135, 108 and 90, all more than their wheat, so their ratios are below 1.5. For S, , which is less than 130, so S is above 1.5. The answer is S.
Question 11
From the same graph: state T's wheat production is approximately what percent of the total wheat production of the five states? (a) 10% (b) 15% (c) 20% (d) 25%
Answer. Grouping, and , so the total is , about 500. T's share is about , which is (b). The exact value is 14.94%; the options are 5% apart, so 500 was close enough.
Time check: about 25 seconds.
Question 12
From the same graph: find the average rice production per state.
Answer. The rice figures are 64, 90, 72, 84 and 60. From a guess of 75, the deviations are and , which add up to . So the average is 74 lakh tonnes.
Question 13
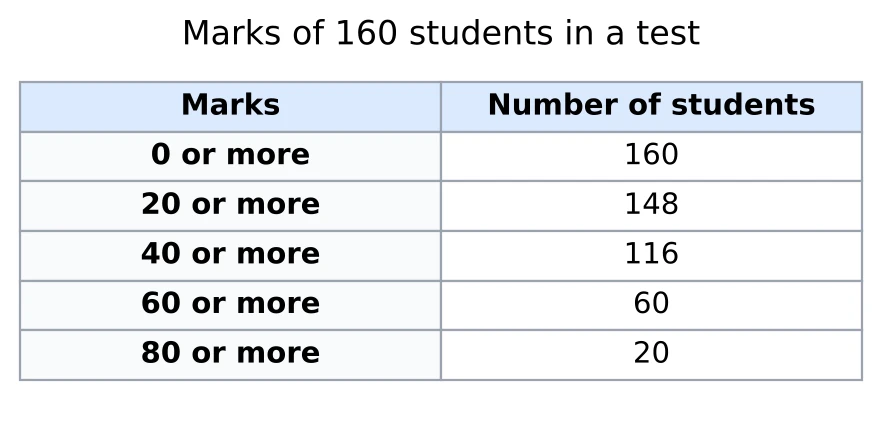
The table shows the marks of 160 students in a test as a cumulative 'or more' table.
How many students scored 40 or more but less than 60?
Answer. '40 or more' counts 116 students, and 60 of them also appear in '60 or more'. The ones in between number 56.
Question 14
From the same table: what percentage of the students scored less than 40?
Answer. 116 students scored 40 or more, so scored less than 40. Then 27.5%.
Question 15
In a test, 75% of 240 boys and 90% of 160 girls passed. What percentage of all the students passed?
Answer. The plain average of 75 and 90 is 82.5, but there are more boys than girls, so the answer must be lower than that. 180 boys and 144 girls passed, 324 in all, out of 400. So 81% passed. With the weights 3 : 2 it is one line: .