
Reading a DI Set
- Read the question first, then pick out only the values it needs.
- Check the unit in the title or on the axis, such as 'in ₹ crore', 'in thousands' or 'in %', and carry it into the answer.
- Values printed on bars, points or slices are exact; values read off a grid line need care.
- One chart can carry two to four questions, so keep the values you have already found.
- Look at the options first: far apart means you can estimate, close together means you must calculate.
Percentage Change and Percentage Points
- Percentage change .
- In 'A is what percent more than B', B is the base. If A is r% more than B, B is less than A.
- A share falling from 20% to 18% drops 2 percentage points, which is 10% of itself.
- Changes of a% and b% in a row make percent (a fall is negative).
For example: 320 to 400 is a 25% rise, but 400 back to 320 is a 20% fall.
Fractions Worth Knowing
| 16.67% | 14.29% | 12.5% | 11.11% | 9.09% | 8.33% | 6.25% |
Also , , and . Cancel a fraction before dividing; it may turn into one of these.
For example: 91 out of 728 is , since , so it is 12.5%.
Ratios, Averages and Missing Values
- Keep a ratio in the question's order, then cancel.
- Compare with through and .
- The average is the total over the count; deviations from a round guess save adding.
- A missing value is the average times the count, minus the sum of the others.
- A combined percentage is total part over total whole, not the average of the percentages.
For example: four values average 55; three are 48, 62 and 51, so the fourth is .
Tables
- Read the headings and the unit line before any value.
- In a two-way table, the row totals and the column totals reach the same grand total.
- For 'in how many years was A more than B', test every year; 'more than' leaves out 'equal to'.
- In a 'less than' table, a class frequency is the difference of neighbouring entries, and 'x or more' is the total minus 'less than x'.
For example: 'less than 40' is 18 and 'less than 60' is 42, so the class 40 to 60 has 24.
Bar Graphs
- Simple bars: use the printed values, or read each bar top across to the scale.
- Grouped bars: match each shade or pattern with the legend first.
- Stacked bars: the top of a bar is the total, and each part is the length of its own segment.
- The tallest bar is the largest value; the largest percentage rise depends on the base.
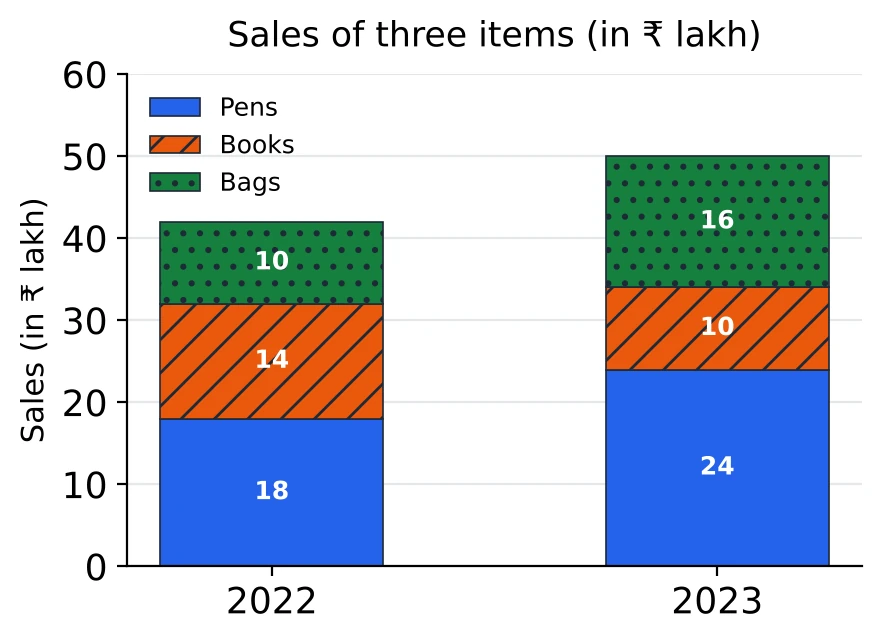
For example: in 2023, Books is the middle segment, from 24 to 34, so Books sold ₹ 10 lakh.
Pie Charts
- is 100%, so ; an angle divided by 3.6 is its percentage.
- The value of a sector is its percentage of the total, or its angle times the value of .
- The ratio of two sectors is the ratio of their angles or percentages; no total is needed.
- With two pie charts of different totals, turn the shares into amounts before comparing.
For example: a sector of is 27.5%; out of a total of ₹ 4,000, that is ₹ 1,100.
Line Graphs
- The steepest segment is the biggest change in number, not always the biggest change in percent.
- Where two lines cross, the order of the two series changes between those years; the crossing itself is not a data value.
- For the average over the years, add the points and divide, or use deviations.
- On a graph of percentage growth over the previous year, any point above zero means the value rose, even where the line falls. Multiply the fractions year by year.
For example: growth of 25% and then 20% on 200 gives .
Histograms and Frequency Polygons
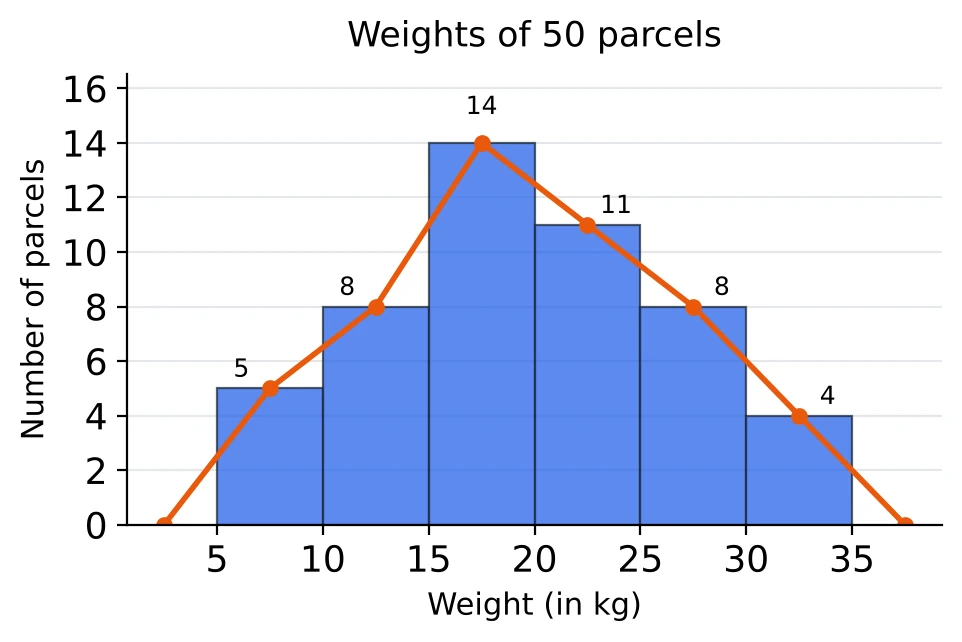
- With equal classes, the height of a bar is the class frequency.
- 'At least x' adds the bars from x upwards; 'less than x' adds the bars below x.
- A frequency polygon joins the mid-points of the bar tops and is closed at the mid-points of the empty classes at both ends.
- [Tier 2] With unequal classes the height is frequency density, so the frequency is the height times the width when the height is per unit (per year, per km), and the height times the width divided by 10 when it is per 10 units. Read the axis label to see which.
Mixed Charts
- When one chart gives totals and the other gives shares, ratios or rates, a value is a total times a share.
- Take from each chart only the number the question needs, and check both are for the same year.
- A total N in the ratio a : b splits into and .
For example: sales of ₹ 640 crore with North's share at 15% give North ₹ 96 crore. Split 5 : 3 between two products, the first gets ₹ 60 crore.
Before the Exam
Mistakes to watch for:
- dividing a change by the new value instead of the earlier one;
- giving percentage points as percent;
- turning a ratio upside down;
- reading the wrong year or series;
- taking degrees for percent;
- comparing shares across pie charts with different totals;
- dropping the unit, or reading a histogram class one bar off.
Then sit the Chapter Test: 25 questions in 15 minutes, with for a right answer and for a wrong one.