
Reading a Table: Title, Rows, Columns and Units
A data table is a grid of numbers under a title. Before working anything out, spend ten seconds on four things.
- The title. It says what is being counted: sales, production, students, marks.
- The unit. “(in ₹ lakh)”, “(in thousands)”, “(in tonnes)”. Every number in the table is in that unit, and the options may be in another one.
- The rows and the columns. A row runs across the page and a column runs down it. Here each row is a year and each column is a city.
- A total row or column. Some tables give it and some don't. If it is there, use it; if not, add it yourself only when a question needs it.
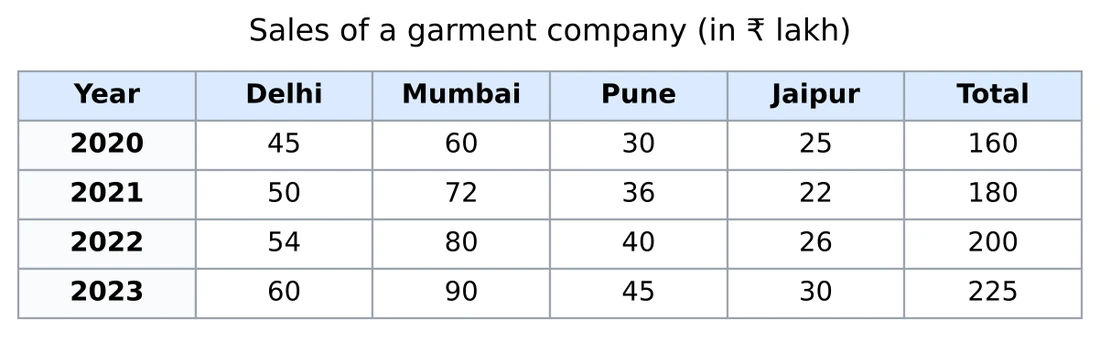
The entry in the 2022 row and the Mumbai column is 80. With the unit, that means sales of ₹ 80 lakh in Mumbai in 2022, which is ₹ 8 crore (1 crore = 100 lakh). A question can ask for the total sales in Pune over the four years in ₹ crore. The column adds to lakh, so the answer is ₹ 1.51 crore, and an option of ₹ 151 crore will be there for anyone who drops the unit.
Check a given total once. For 2020, , which matches the Total column. The check takes a few seconds and tells you how the table is built. A Total column also saves work later: the share of Delhi in the 2023 sales is just , with nothing to add.
Units you will meet.
- 72 in a table “in thousands” means 72,000.
- 2.5 in a table “in lakh” means 2,50,000.
- 1 lakh = 100 thousand, and 1 crore = 100 lakh.
Units cancel in a ratio or a percentage, so is the same fraction whether the sales are in lakh or in crore. They matter only when the answer is an amount. That is why you should look at how the options are written (151, 1.51, 15,100) before you pick one.
Totals and Averages of a Row or Column
A row total adds across one row and a column total adds down one column. An average is the total divided by the number of entries you added.
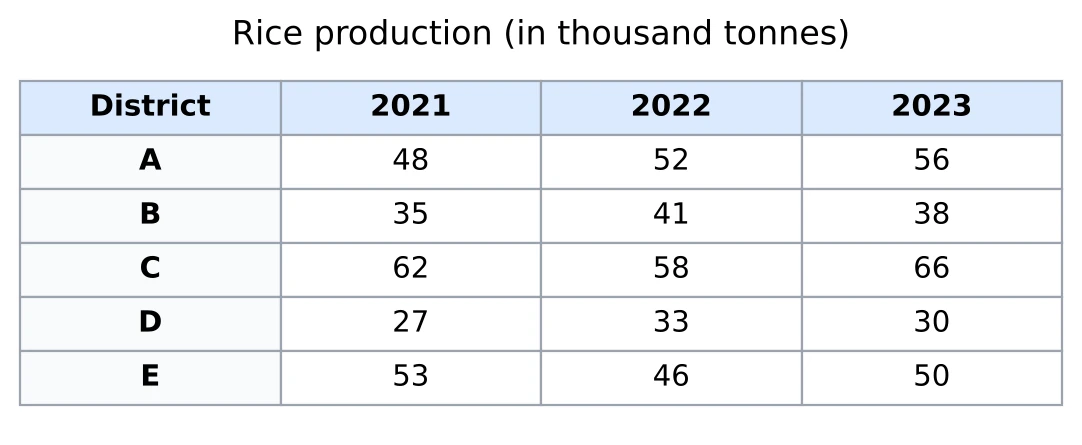
- District A over the three years: thousand tonnes, so its yearly average is thousand tonnes.
- All five districts in 2023: thousand tonnes, an average of thousand tonnes per district.
The divisor is where marks are lost. “Average production of district C” divides by 3, the number of years. “Average production per district in 2022” divides by 5, the number of districts. Before dividing, say in words what you added.
Adding fast with a working mean. For a column of numbers close to each other, pick a round number near the middle and add only the differences from it. For 2023, take 50. The differences are , which add up to . So
and the total is . With five two-digit numbers this saves little; with eight three-digit numbers it saves a lot (see Chapter 5 for why it works).
Highest average without dividing. Which district had the highest average over the three years? Every district has three entries, so the highest average belongs to the highest row total. C has , and no other row comes close. When the counts are equal, compare totals and divide once at the end, if at all.
Average of a part of a row. The average of 2021 and 2022 for district D uses only those two cells: thousand tonnes. The 2023 cell stays out because the question did not ask for it.
A Value as a Percentage of a Total or of Another Value
Two questions look alike and are not.
- “What percentage of the total is X?” Divide X by the total.
- “X is what percentage of Y?” Divide X by Y.
In both, the quantity after the word “of” goes at the bottom of the fraction.
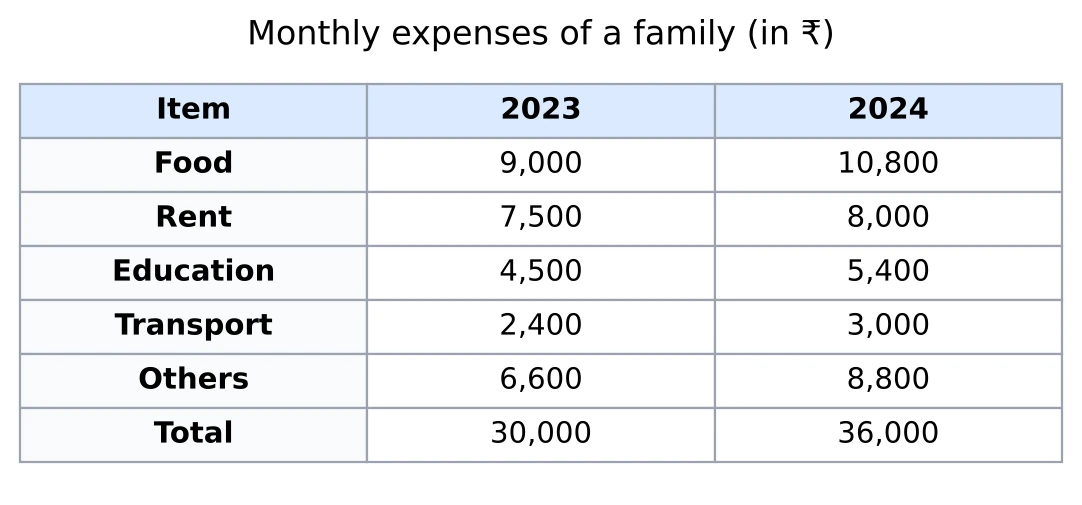
Percentage of the total. Rent in 2023 was ₹ 7,500 out of ₹ 30,000:
Cancel first and multiply by 100 last. Food was of the total and Transport .
One value as a percentage of another. In 2023, Education was what percentage of Food? . Turned around, Food was of Education. Each number is right for its own question, so expect to see both in the options.
Across two columns. Food spending in 2024 is what percentage of food spending in 2023? . Put another way, it rose by 20%, which is how percentage change works (next topic).
Fractions to keep ready. , , , , . Transport in 2024 was of the total, so its share is without any long division. Chapter 3 has the full list.
[SSC Tip] Two or three questions are set on one table. When the table has no Total row and the first question needs a total, write it beside the table at once. The next question on the same table may well need it again.
Percentage Increase or Decrease from Year to Year
The old value, the earlier year, is the base (Chapter 3 has the details).

Each year against the one before it:
| Year | Exports | Change | Percentage change |
|---|---|---|---|
| 2020 | 100 | rise | |
| 2021 | 90 | fall | |
| 2022 | 120 | rise | |
| 2023 | 150 | rise | |
| 2024 | 165 | rise |
The base decides the answer. Exports fell from 100 to 90, a fall of 10%. The climb back from 90 to 100 would be , not 10%. Dividing by the new value is the mistake to watch for.
Greatest rise in amount and in percentage are different questions. 2022 and 2023 both rose by ₹ 30 crore. In percentage terms 2022 is ahead, because the same 30 was added to a smaller base (90 against 120). So the greatest percentage increase was in 2022, while the greatest increase in ₹ crore is shared by 2022 and 2023.
Compare fractions, not percentages. To find the largest percentage rise you only need for each year: , , , . beats at a glance. Turn the winner into a percentage only if the question asks for the figure.
Least increase. Read the wording closely. “The least percentage increase” looks only at the years that rose, which here is 2024 (10%). “The greatest decrease” points to 2021, the only fall.
Change over several years. From 2019 to 2024 the rise is . Use the two end values. Adding the yearly percentages () does not give the overall change, because each year's percentage is on a different base.
Ratios Between Rows and Columns
A ratio compares two entries, or two totals, in the order the question names them. “Arts to Science” means Arts first.
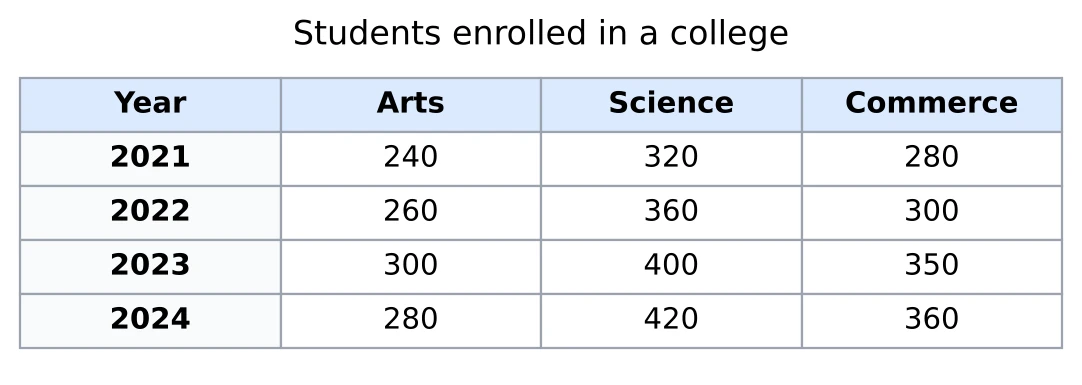
Two cells. Arts to Science in 2023 is . Divide both terms by their common factor in one go (100 here) rather than in small steps.
Two totals. Total Arts over the four years is , and total Science is . The ratio is ; dividing by 60 leaves . If the common factor isn't obvious, divide by 10 and then by small primes (2, 3, 5) until nothing more cancels.
Ratio of averages. Both streams were counted over the same four years, so the ratio of their averages equals the ratio of their totals, , and the averages themselves are never needed. This works only when the counts are equal. A four-year average of Arts against a two-year average of Science has to be worked out separately.
One column, two years. Commerce in 2021 to Commerce in 2024 is . The ratio also shows the growth: 2 more parts on 7, so Commerce grew by , about 28.6%.
A ratio inside a cell. Suppose the question adds that in 2022 the ratio of boys to girls in Science was . The table gives 360 Science students, so the girls number . Parts become real numbers by dividing the total by the sum of the parts (Chapter 4).
The order of the terms. In “the ratio of Science in 2024 to Arts in 2021”, the first term is 420 and the second is 240, so the ratio is . The upside-down will be one of the wrong options, so write the two numbers down in the order of the words before cancelling.
Counting Questions: “In How Many Years …?”
Some questions ask you to count rather than calculate: “In how many years did dealer X sell more cars than dealer Y?” There is no formula. Go down the rows and mark each one.
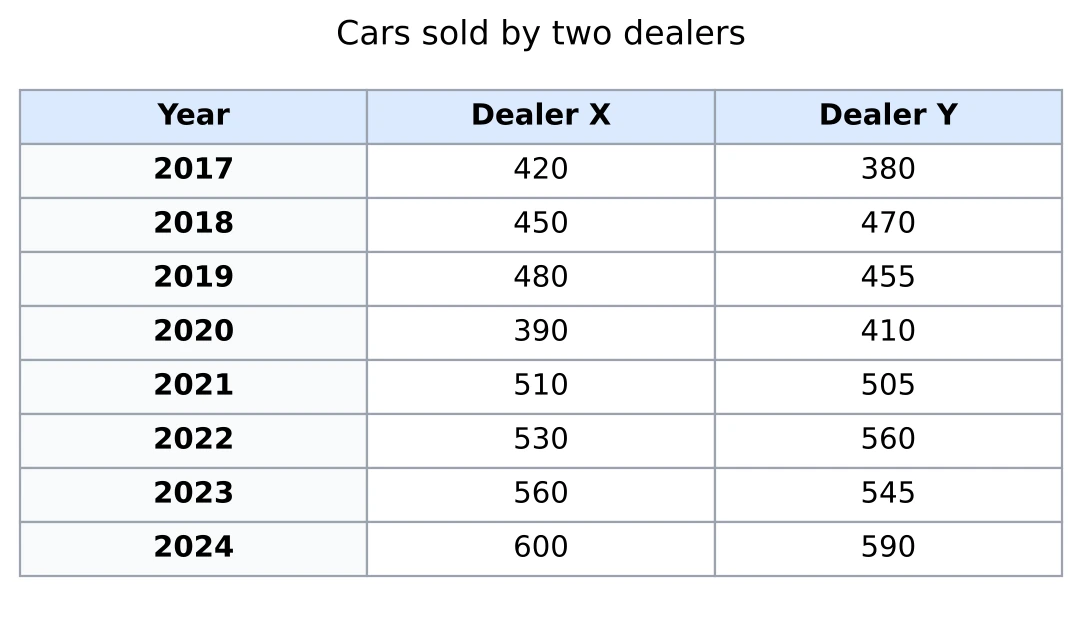
Row by row: 2017 yes, 2018 no, 2019 yes, 2020 no, 2021 yes, 2022 no, 2023 yes, 2024 yes. X sold more in 5 years.
Rise over the previous year. “In how many years did X sell more than in the year before?” Compare each entry with the one above it: 450 > 420, 480 > 450, 390 < 480, and then 510, 530, 560 and 600 all rise. That is 6 years. 2017 is not counted, since the table has no year before it.
Above the average. “In how many years were X's sales above its own average?” The total is 3940, so the average is . Only 510, 530, 560 and 600 are above it: 4 years. Here the exact average hardly matters. Once you see that it is just under 500, every entry falls clearly on one side.
Largest difference. “In which year was the difference between the two dealers the greatest?” Write the gaps: 40, 20, 25, 20, 5, 30, 15, 10. The greatest is 40, in 2017. The question is about the size of the gap, whichever dealer was ahead.
Habits for counting.
- Make a mark for every row, including the ones that say no, so you can recount in seconds.
- Look twice at the close pairs (510 and 505 in 2021). They are the ones most easily misread.
- See whether the question says “more than” or “at least”. An equal pair counts for “at least” but not for “more than”.
[SSC Tip] A count can't be checked by working back from the options, and the four options are neighbouring numbers such as 3, 4, 5 and 6. Mark every row on paper; a count kept in the head is easily off by one.
Two-Way Tables
A two-way table sorts the same people, or the same output, in two ways at once. Here every student belongs to one class and to one gender, so each cell answers two things: class IX and girls is 40.
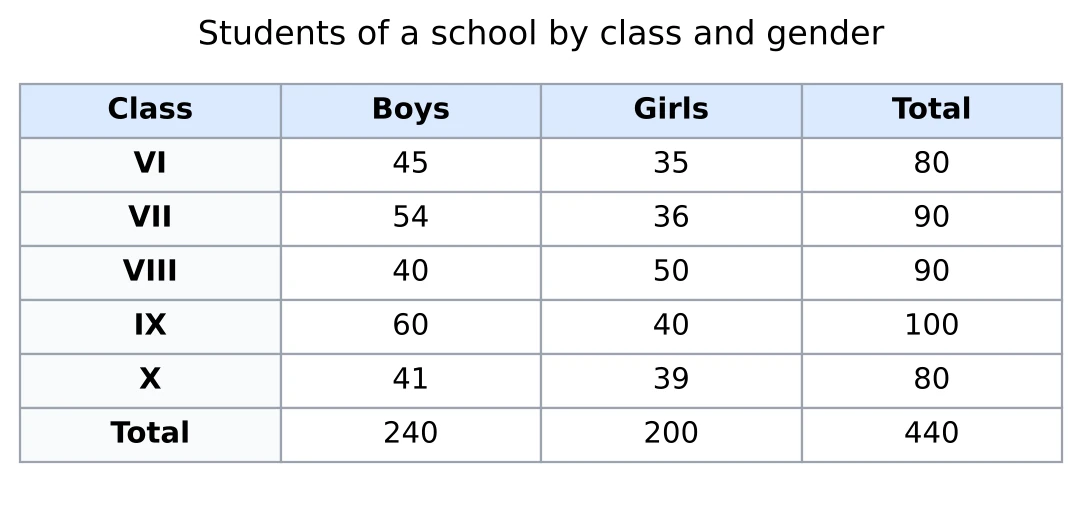
The last column adds each row (all the students of a class) and the last row adds each column (all the boys, all the girls). The corner cell, 440, is the grand total. It must equal both the sum of the Total column and the sum of the Total row, which makes it a good check on your reading.
Which total is the base? Most mistakes in two-way tables come from dividing by the wrong total. The same cell, girls of class IX, gives three different answers:
- “What percentage of the students of class IX are girls?” The base is class IX: .
- “What percentage of all the girls are in class IX?” The base is all girls: .
- “What percentage of the school's students are girls of class IX?” The base is everyone: .
Underline the group that follows “of” before you divide.
Ratios inside and across. Boys to girls in the whole school: . Boys to girls in class VIII: . Class VIII has more girls than boys even though the school as a whole has more boys, so a ratio for one row says nothing about the totals.
Production tables are two-way too. In a table of production by company (rows) and year (columns), a row total is one company's output over all the years and a column total is the output of all the companies in one year. “Company B's share of the 2023 production” divides by the 2023 column total; “the share of 2023 in company B's output” divides by B's row total.
A blank cell. If one cell were empty, its row or column total would fill it: girls in class X .
Cumulative Frequency Tables: “Less Than” and “More Than”
A cumulative table does not give the number in each class. Each entry is a running total: “less than 30: 40” means 40 students scored below 30, counting everyone from the lowest mark up.
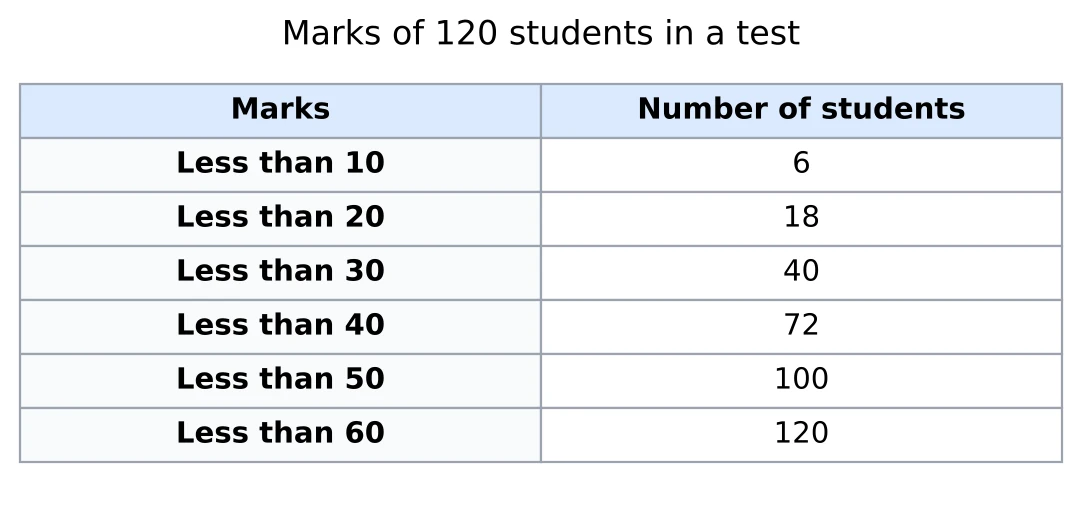
Getting a class back. The number in a class is the difference of two neighbouring entries. Those who scored 30 or more but less than 40 number . Doing this for every row:
| Marks | 0-10 | 10-20 | 20-30 | 30-40 | 40-50 | 50-60 |
|---|---|---|---|---|---|---|
| Students | 6 | 12 | 22 | 32 | 28 | 20 |
The class numbers add up to 120, the last entry of the table.
Ranges. Students with 20 or more but less than 50 marks: . There is no need to find the separate classes; subtract the entry at the lower end from the entry at the upper end.
“At least” questions. Students with 30 marks or more: everyone minus those below 30, .
The “more than” form. The same data can be counted from the top:
| Marks | 0 or more | 10 or more | 20 or more | 30 or more | 40 or more | 50 or more |
|---|---|---|---|---|---|---|
| Students | 120 | 114 | 102 | 80 | 48 | 20 |
These entries fall as you go right, and a class is again a difference: 40-50 has . The first entry counts everyone and the last one is the top class alone.
The class with the most students is the largest difference, not the largest entry. In a “less than” table the largest entry is the last one, because it counts everybody. Here the largest difference is 32, for the class 30-40.
[SSC Tip] A mark equal to a boundary belongs to the class that starts there. A student with exactly 30 is not “less than 30”, so that student is counted in 30-40. Questions written as “30 or more but less than 40” are spelling out this rule for you.
The median of such data and other work with grouped data come in Chapter 19.
Tables of Percentages: Marks Out of Different Maximums
Some tables do not give marks at all. They give the percentage of marks, with the maximum marks of each subject in brackets under its name. Every entry has to be turned into marks before marks can be added.
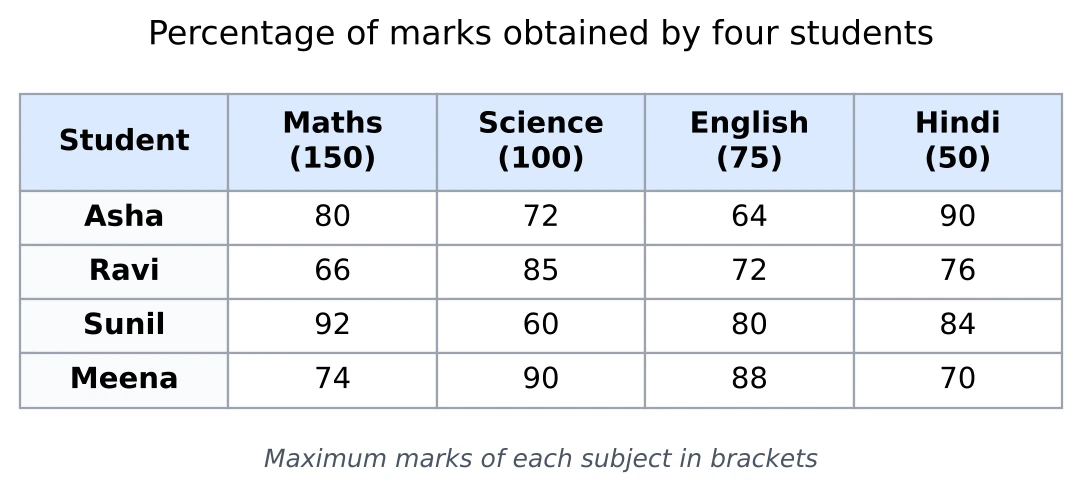
Asha's marks: Maths , Science 72, English , Hindi . Her total is out of .
Overall percentage. Asha's overall percentage is . The average of her four percentages is , which is wrong, because Maths (out of 150) carries three times the weight of Hindi (out of 50). The two agree only when every subject has the same maximum.
When no conversion is needed. Within one subject every student has the same maximum, so the percentages compare directly: in English, Meena (88) did better than Sunil (80). Their gap in marks is .
Percentage points. Meena's Science score is percentage points above Asha's. In percent terms it is more. A question that asks “by what percent” wants the 25, not the 18 (Chapter 3 explains percentage points).
Comparing two subjects for one student. Sunil has 92% in Maths and 60% in Science. In marks that is 138 and 60, a gap of 78 marks, although the percentages differ by only 32. Whenever the subjects differ, compare marks, not percentages.
Tables with a Missing Value
Sometimes an entry is replaced by a question mark, and the question gives a total, an average or a percentage from which it can be found.
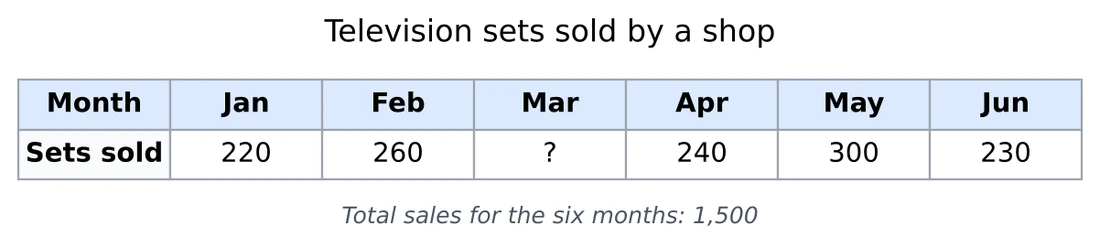
From a total. The six months add up to 1,500. The five known months add up to , so March is .
From an average. Suppose the question said instead that the average monthly sale was 250. The total is then , and the rest is the same. With an average there is a quicker way: write each known month as its difference from 250, that is . These add up to 0, so the missing month must be exactly 250 for the differences to balance.
From a percentage. A line such as “March sales were less than May sales” fixes March too: .
Two missing values. A table may hide two cells and give two totals, say a row total and a column total. Start with the row or column that has only one unknown, find that cell, and then use it to find the second. One total cannot give two unknowns.
Write the found value in. The next question on the table will need the missing value, for instance the percentage rise from March to May, which is . Fill the question mark in as soon as you find it, so the later questions use the right number.
Approximation When the Options Are Far Apart
Real tables have awkward numbers, and a fraction like takes time to divide. Look at the options before you start. If they are far apart, an estimate is enough; if they are close, work exactly.
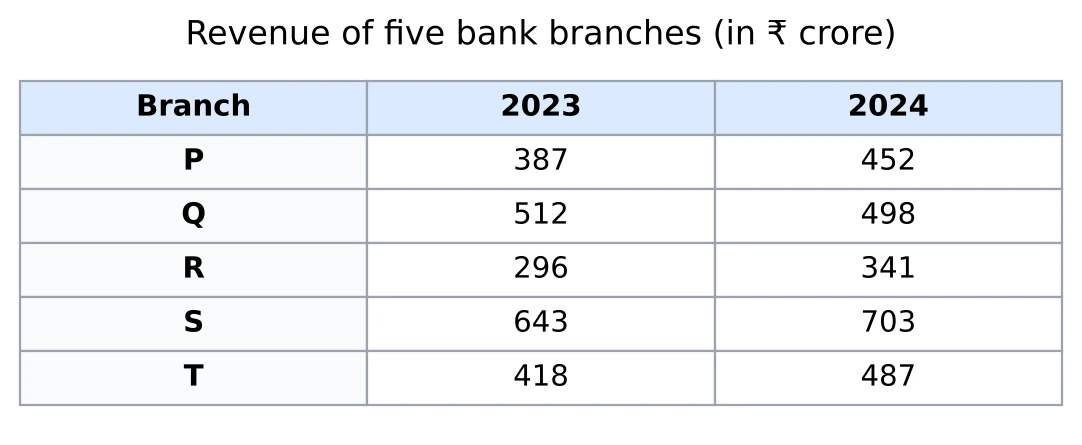
An estimate that is enough. What percentage of the 2024 revenue came from branch S, if the options are 22%, 28%, 34% and 40%? The 2024 total is , close to 2500, and S is about 700. . The options are 6 points apart and the rounding error is far smaller, so 28% is safe. (The exact value is about 28.3%.)
How far to round.
- Two significant figures are plenty: 703 becomes 700, 2481 becomes 2500, 341 becomes 340.
- Rounding the top down and the bottom up, as here, makes the estimate a little low. Keep that in mind when an option sits just above your figure.
When the options are close. Branch R grew from 296 to 341, by . If the options are 10%, 15%, 20% and 25%, then settles it. If they are 14.8%, 15.2%, 15.6% and 16%, you must divide: , so 15.2%.
Rough totals. For the approximate revenue of all five branches in 2023, round each to the nearest 10 and add: , against the exact 2256. When the options differ by 100 or more, that is accurate enough.
When estimates tie. Which branch had the largest percentage growth? Roughly, P grew , about 17%; Q fell; R about 15%; S , about 9%; T , about 16.5%. P and T are too close to call by rounding (16.8% and 16.5%), so compare those two exactly by cross-multiplying: and . The first is larger, so P's growth is the largest. Estimate first to throw out the clear losers, then work exactly on the two that are left.
Solved Examples
Question 1
The table shows the number of vehicles (in thousands) made by a company from 2020 to 2024.
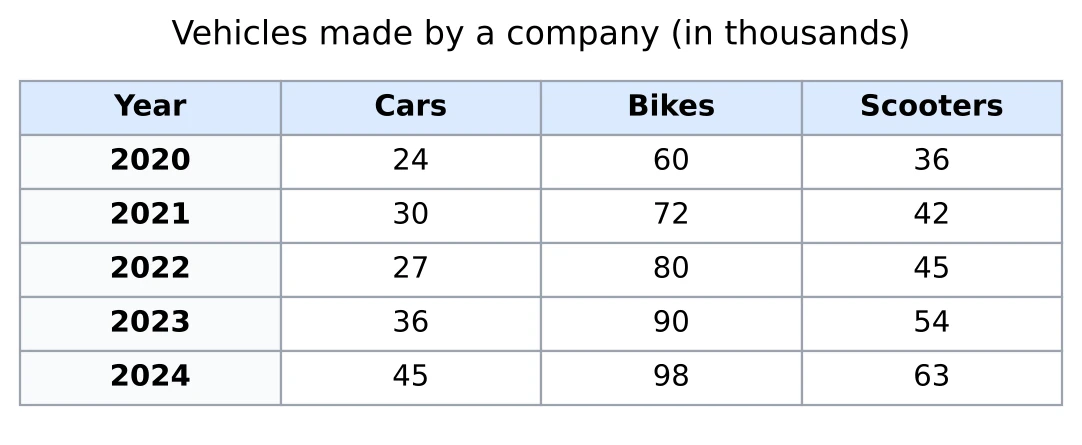
What was the average number of bikes made per year? (a) 1,00,000 (b) 80,000 (c) 8,000 (d) 85,000
Answer. I add the Bikes column: thousand. There are five years, so the average is thousand, which is (b) 80,000. The table is in thousands, so the 80 on my paper means 80,000 bikes. Dividing by 4 by mistake would have given 1,00,000.
Question 2
By what percentage did the number of cars made rise from 2023 to 2024? (a) 20% (b) 9% (c) 25% (d)
Answer. Cars went from 36 thousand to 45 thousand, a rise of 9 thousand. The base is the earlier year, 36. , so the rise is (c) 25%. If I had divided 9 by 45 I would have got 20%, which is how much lower 2023 was than 2024.
Question 3
What is the ratio of the total number of scooters to the total number of cars made in the five years? (a) 40 : 27 (b) 27 : 40 (c) 3 : 2 (d) 7 : 5
Answer. Scooters: . Cars: . So the ratio is . Both are even, so I halve them to get , and both of those divide by 3, which leaves . The answer is (a) 40 : 27, with scooters first because the question names them first.
Question 4
The table shows the number of men and women working in the five departments of a company.
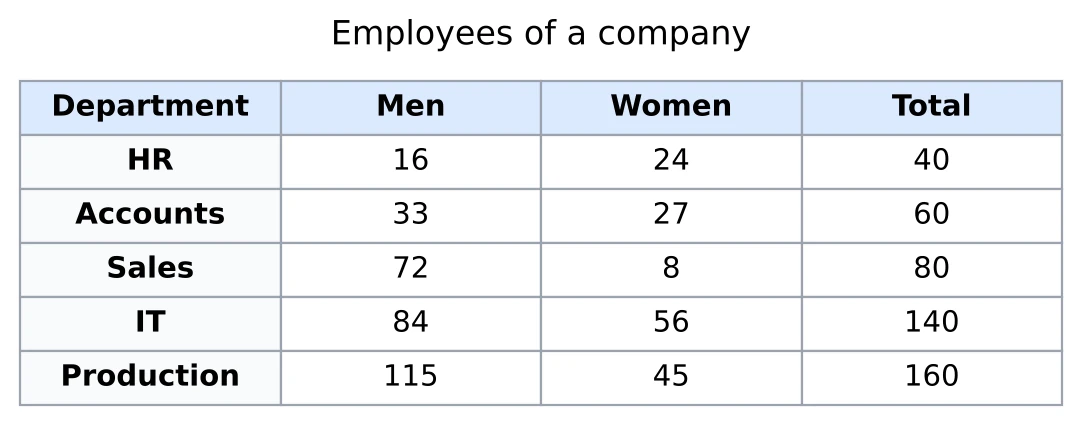
What percentage of the company's employees are women? (a) (b) 50% (c) 40% (d)
Answer. Women: . All employees: the Total column adds to . So the share is , which is (a) . 50% is what you get by comparing the women with the men (160 out of 320) when the question compares them with everyone.
Question 5
In which department do women form the largest share of the employees? (a) IT (b) Accounts (c) Production (d) HR
Answer. This is women as a share of each department, so every row has its own base. HR: . Accounts: . Sales: . IT: . Production: , about 28%. The largest is (d) HR. IT has the most women, 56, but it is also a big department, so their share there is smaller.
Question 6
The women working in IT form what percentage of all the women in the company? (a) 40% (b) 35% (c) (d) 56%
Answer. Now the base is all the women, 160, which I found in the first question on this table. , and . The answer is (b) 35%. The 40% from the last question used IT's own total as the base; the words “of all the women” change it.
Question 7
The table shows the rainfall (in mm) in a city during the monsoon months of 2023 and 2024.
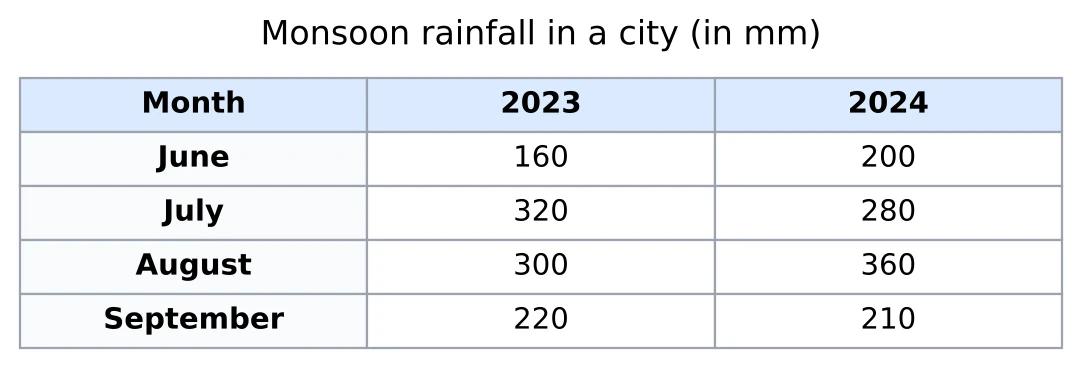
By what percentage did the rainfall in July change from 2023 to 2024? (a) decrease (b) 12.5% decrease (c) 12.5% increase (d) 40% decrease
Answer. July fell from 320 mm to 280 mm, a fall of 40 mm. The base is 2023: , and is 12.5%. So the answer is (b) 12.5% decrease.
Question 8
In which month was the percentage increase in rainfall from 2023 to 2024 the greatest? (a) June (b) August (c) July (d) September
Answer. Only June and August had more rain in 2024. June: . August: . August gained more millimetres, but on a bigger base, so the larger percentage rise belongs to (a) June.
Question 9
By what percentage was the total monsoon rainfall of 2024 more than that of 2023? (a) (b) 10% (c) 2.5% (d) 5%
Answer. 2023: mm. 2024: mm. The total went up by 50 mm on a base of 1000, so it was (d) 5% more. With 1050 at the bottom the answer would come out a little under 5%, but “more than that of 2023” puts 2023 at the bottom.
Question 10
The table shows the ages of the 160 employees of a factory. No employee is younger than 20 or as old as 50.
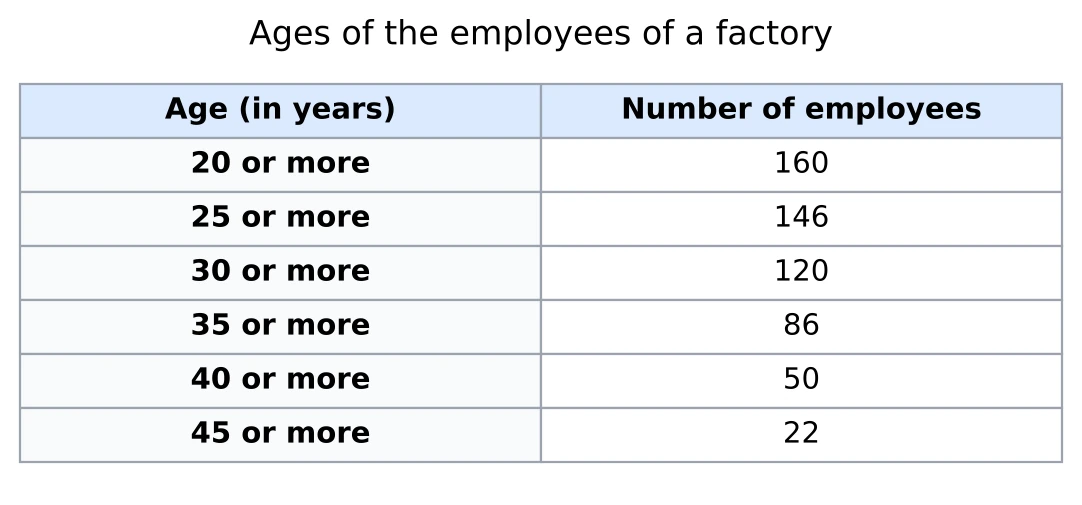
How many employees are 30 years or older but younger than 40? (a) 34 (b) 36 (c) 70 (d) 86
Answer. The table says 120 employees are 30 or more and 50 are 40 or more. The ones in between are , so the answer is (c) 70.
Question 11
Which age group has the largest number of employees? (a) 30-35 years (b) 20-25 years (c) 45-50 years (d) 35-40 years
Answer. I find each group by subtracting neighbouring entries: 20-25 has , 25-30 has 26, 30-35 has 34, 35-40 has 36 and 40-45 has 28. The last group, 45-50, is just the last entry, 22, because nobody is 50. The largest is 36, so the answer is (d) 35-40 years, just ahead of 30-35. The biggest number in the table, 160, counts everyone, so it doesn't point to any one group.
Question 12
What percentage of the employees are younger than 30? (a) 25% (b) 75% (c) 16.25% (d) 8.75%
Answer. Younger than 30 means everyone except those who are 30 or more: . , which is (a) 25%. 75% is the share of employees aged 30 or more, read straight off the table.
Question 13
The table shows the percentage of marks obtained by four students in three subjects. The maximum marks of each subject are given in brackets.
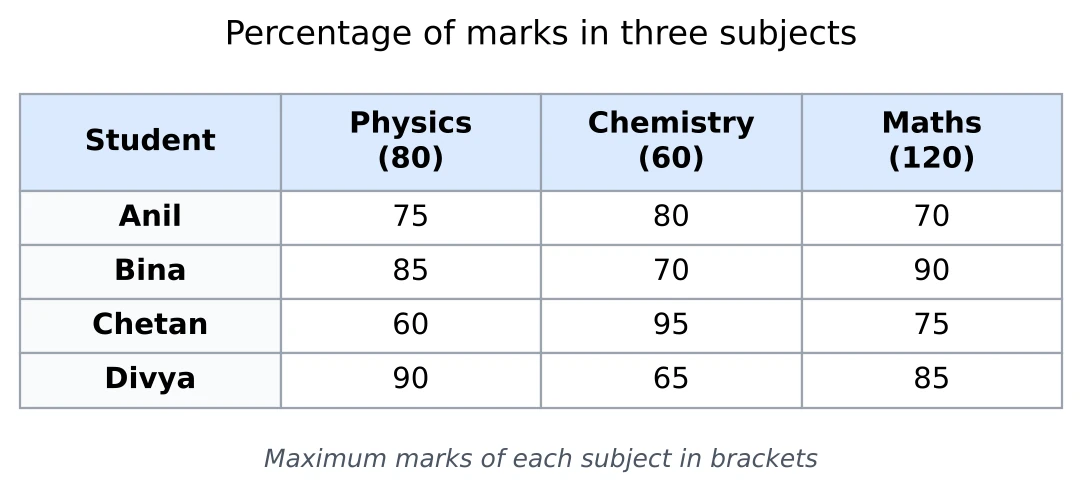
What are Bina's total marks in the three subjects? (a) 218 (b) 245 (c) 215 (d) 208
Answer. Each percentage has to become marks out of that subject's maximum. Physics: . Chemistry: . Maths: . Total: , so the answer is (a) 218. Adding the three percentages (245) mixes percentages up with marks.
Question 14
How many more marks did Divya score in Maths than in Physics? (a) 5 (b) 18 (c) 30 (d) 24
Answer. Divya's percentage is higher in Physics (90) than in Maths (85), but the maximums are different. Maths: . Physics: . She scored more marks in Maths, so the answer is (c) 30.
Question 15
What is Chetan's overall percentage in the three subjects? (a) (b) 75% (c) 72.5% (d) 78%
Answer. His marks are in Physics, in Chemistry and in Maths. That is out of , and , so (b) 75%. I was about to average 60, 95 and 75, but that treats the 60-mark paper as if it were worth as much as the 120-mark one.
Question 16
The table shows the cement produced by four plants (in lakh tonnes). The average production of the four plants in 2023 was 44 lakh tonnes, and their total production in 2024 was 200 lakh tonnes.
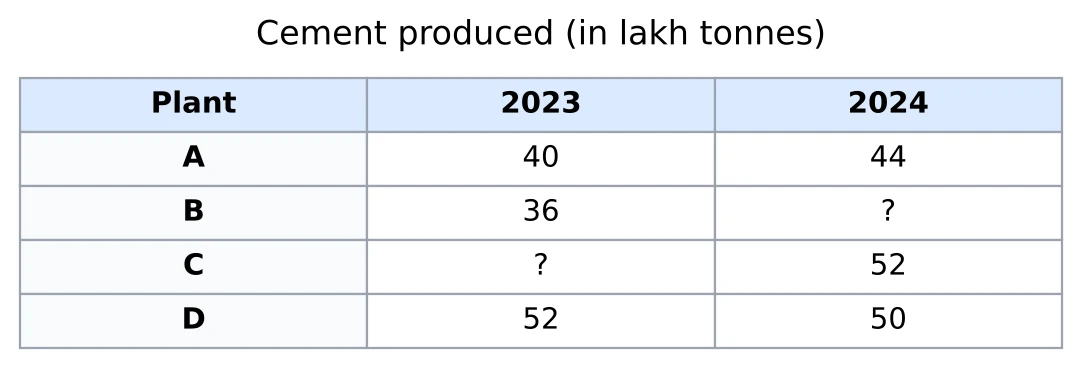
How much cement did plant C produce in 2023? (a) 44 lakh tonnes (b) 48 lakh tonnes (c) 52 lakh tonnes (d) 72 lakh tonnes
Answer. An average of 44 for four plants means a total of . The other three plants made , so C made lakh tonnes: (b) 48 lakh tonnes. The 2023 average is the only figure that belongs to 2023; the 200 is for 2024.
Question 17
By what percentage did plant B's production rise from 2023 to 2024? (a) (b) 18% (c) 25% (d) 50%
Answer. First the missing 2024 figure: . B went from 36 to 54, a rise of 18 on a base of 36, and . The answer is (d) 50%.
Question 18
What percentage of the total 2024 production came from plant B? (a) 26% (b) (c) 27% (d) 22%
Answer. B made 54 lakh tonnes in 2024 (found in the last question) out of a total of 200, and . So (c) 27%. The total of 2024 is the right base here, since the question is about 2024's production.
Question 19
The table shows the sales (in ₹ lakh) of three branches of a store from 2020 to 2023.
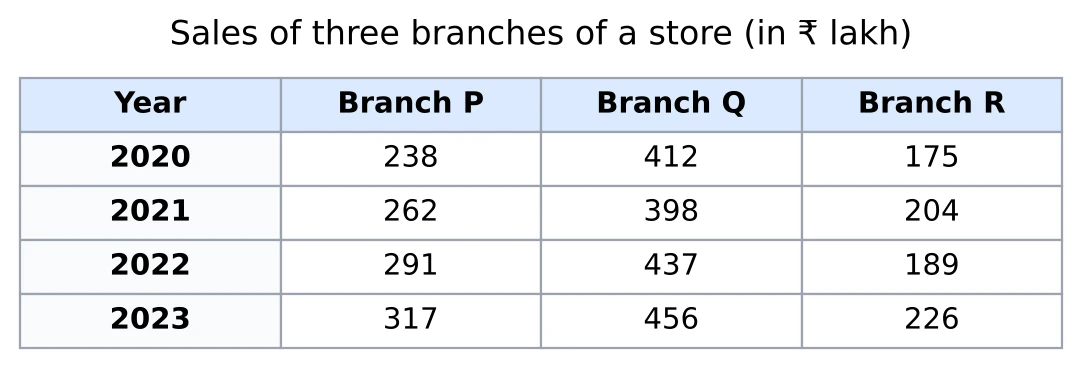
Approximately what percentage of the total sales in 2023 came from branch Q? (a) 46% (b) 36% (c) 56% (d) 26%
Answer. The 2023 total is , which is practically 1000. So Q's share is about , and the nearest option is (a) 46%. The options are 10 points apart, so no more precision is needed.
Question 20
In how many of the four years were the sales of branch P more than 60% of the sales of branch Q? (a) 4 (b) 2 (c) 3 (d) 1
Answer. 60% of Q in each year: 2020, ; 2021, 238.8; 2022, 262.2; 2023, 273.6. P is above these in 2021 (262), 2022 (291) and 2023 (317), but not in 2020 (238 against 247.2). That makes (c) 3 years. 2020 is the close one, so I worked that one out fully.
Question 21
Approximately by what percentage did the sales of branch P grow from 2020 to 2023? (a) 25% (b) 43% (c) 18% (d) 33%
Answer. P rose from 238 to 317, that is by 79. On a base of about 240, is very close to , about 33%. So the answer is (d) 33%. Dividing 79 by 317, the later year, would give about 25%.
Question 22
The table shows the number of students who passed the Class 10 examination from two schools, A and B, from 2019 to 2024.
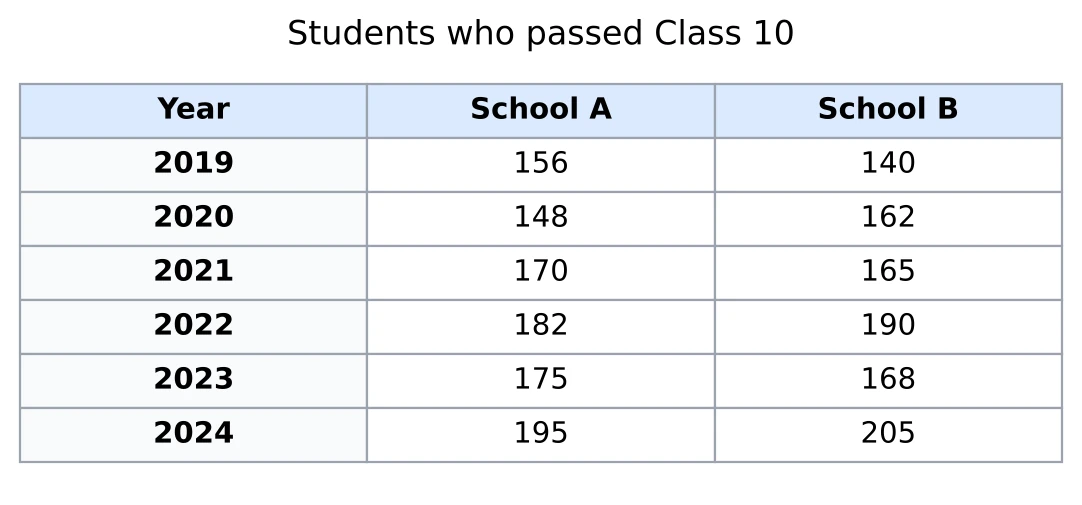
In how many years did more students pass from School A than from School B? (a) 4 (b) 3 (c) 2 (d) 5
Answer. I mark each row with the school that is ahead: 2019 A (156 against 140), 2020 B, 2021 A, 2022 B, 2023 A, 2024 B. A is ahead in (b) 3 years.
Question 23
In how many years was the number of students passing from School B more than School B's average for the six years? (a) 3 (b) 4 (c) 2 (d) 1
Answer. B's total is , so its average is , a little under 172. Only 190 (2022) and 205 (2024) are above it, which makes (c) 2. 168, in 2023, is close but below.