
How to Use These Questions
These 30 questions are built on eleven sets of data: tables, bar graphs, a pie chart, line graphs, histograms, a frequency polygon, and two sets where a pie chart and a table, or a bar graph and a line graph, must be read together. Each set carries two or three questions, as in the exam, and the later questions in a set need more steps. Before calculating, say in words which values the question needs and what the base of any percentage is. Marks in DI are lost more often on a wrong year, a wrong series or a wrong base than on the arithmetic itself.
The last two questions are marked [Tier 2]: they use a histogram whose classes have different widths. If any other question takes you more than about a minute and a half, find the matching method in Shortcuts & Speed Methods and redo the whole set the next day.
Solved Examples
Question 1
The table shows the number of students in three streams in five colleges.
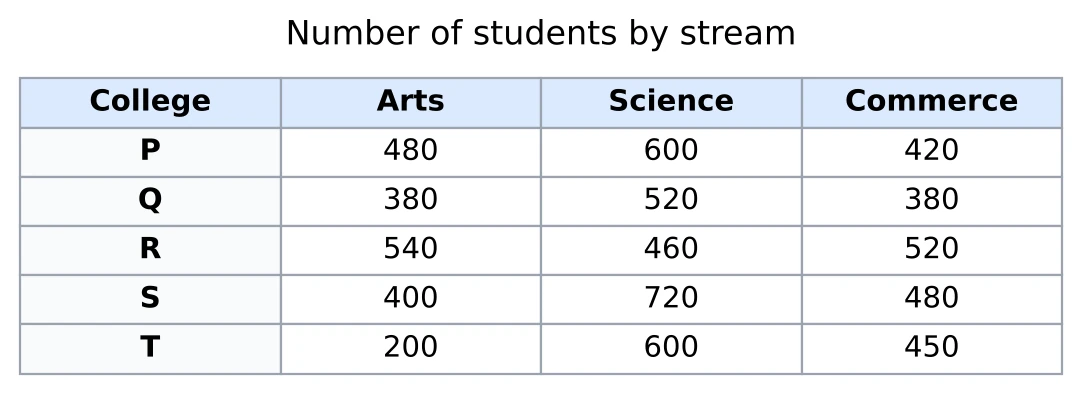
The number of Commerce students in the five colleges together is what percent more than the number of Arts students in the five colleges together?
Answer. I add the two columns by grouping. Arts: . Commerce: . Commerce is 250 more, and the base is the Arts total because Commerce is compared with Arts: , which is 12.5%.
Question 2
From the same table: in which college do Science students make up the largest share of all its students?
Answer. First I need each college's total: P 1,500, Q 1,280, R 1,520, S 1,600 and T 1,250. The Science shares are P , Q just over 40%, R about 30%, S and T . So the answer is T, even though S has more Science students. To be sure of T against S, I cross-multiply: is more than .
Question 3
From the same table: in college P, 20% of the Arts students and 30% of the Science students are girls, and girls make up 40% of all the students of P. How many of P's Commerce students are girls?
Answer. P has 1,500 students, so it has 40% of 1,500 = 600 girls. Arts gives 20% of 480 = 96 girls and Science gives 30% of 600 = 180 girls. All the other girls are in Commerce: 324 girls.
Question 4
The bar graph shows the income and the expenditure of a company (in ₹ crore) from 2019 to 2023. Profit is income minus expenditure.
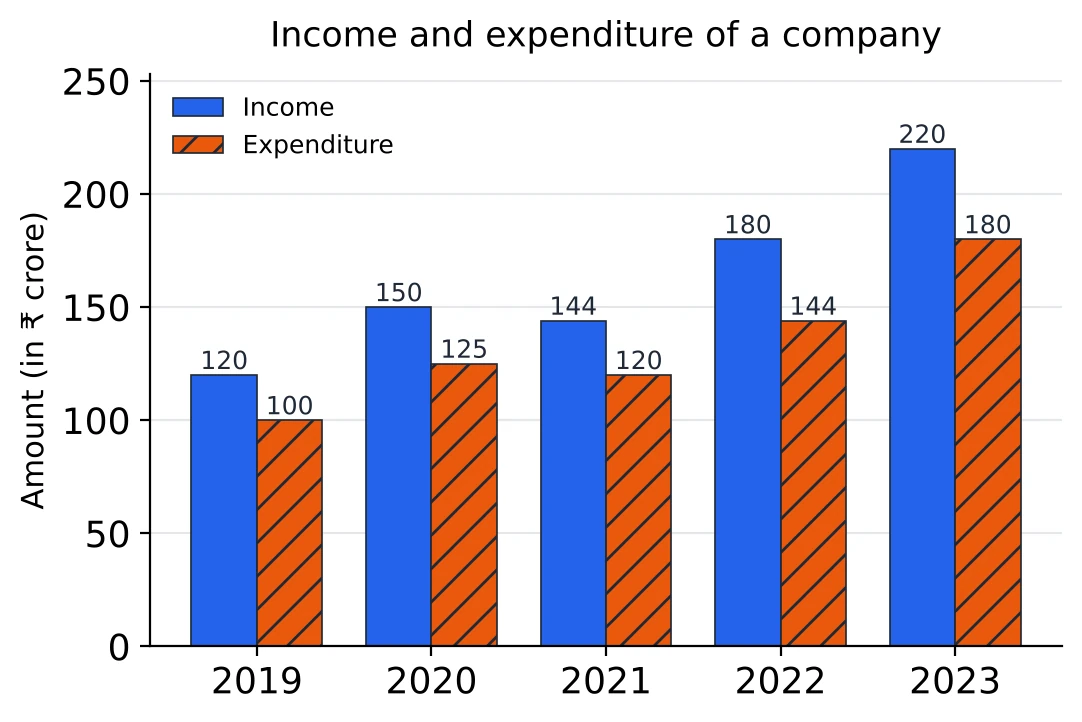
In which year was the profit as a percentage of the expenditure the highest?
Answer. The profits are 20, 25, 24, 36 and 40 crore. As a part of each year's expenditure: 2019 , 2020 , 2021 , 2022 and 2023 , about 22.2%. The highest is 2022. 2023 has the biggest profit, but it is earned on a bigger expenditure.
Question 5
From the same graph: by what percentage did the company's income rise from 2021 to 2022?
Answer. Income went from 144 to 180 crore, a rise of 36 on 144. That is , so 25%.
Question 6
From the same graph: in 2024 the company's expenditure is 10% more than in 2023, and its profit as a percentage of expenditure is the same as in 2022. What is its income in 2024?
Answer. The 2024 expenditure is crore. A profit of 25% of the expenditure means the income is of the expenditure: . So the income is ₹ 247.5 crore.
Question 7
The pie chart shows how a family uses its monthly income of ₹ 90,000.
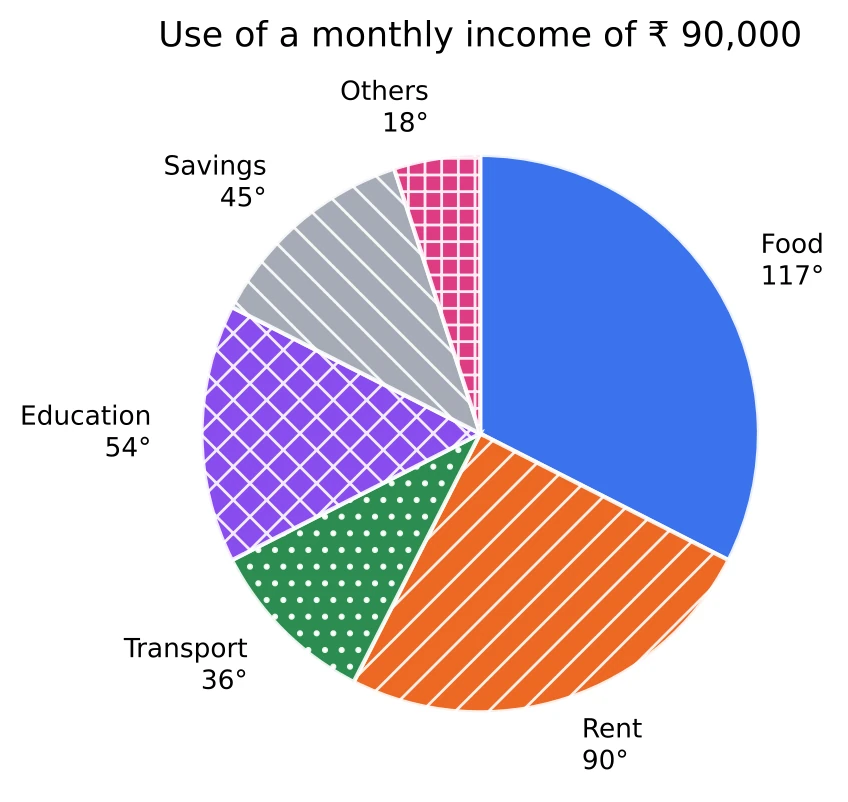
How much more does the family spend on food than on education?
Answer. stands for ₹ 90,000, so is worth ₹ 250. Food and education differ by , which is . So the family spends ₹ 15,750 more on food.
Question 8
From the same pie chart: what percentage of the income goes on rent and transport together?
Answer. , and . So 35% of the income goes on these two.
Question 9
From the same pie chart: the family's income rises by 25%. It spends the same amounts as before on every item and saves the rest. What percentage of the new income does it save?
Answer. The new income is rupees. Everything except savings takes , which is rupees, and this does not change. The new savings are rupees, and 30%. Before the rise, the family saved only 12.5% of its income.
Question 10
The line graph shows the number of units produced and the number sold by a factory (in thousands) from 2018 to 2023.
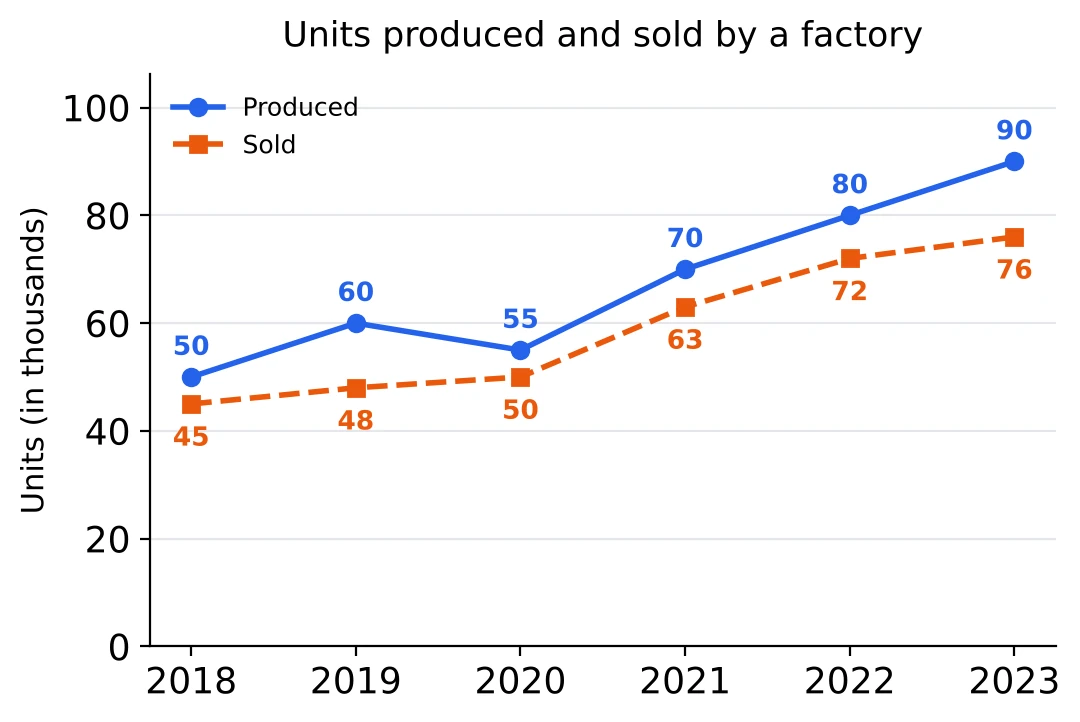
In which year did the factory sell the largest percentage of the units it produced?
Answer. Sold out of produced: 2018 , 2019 , 2020 , about 90.9%, 2021 , 2022 and 2023 , about 84.4%. Three years are at exactly 90%, and 2020 is just above them, so the answer is 2020. I could also see it from the unsold units: in 2020 only 5 of 55 were left, less than a tenth.
Question 11
From the same graph: by what percentage did the number of units sold rise from 2020 to 2021?
Answer. Sales went from 50 thousand to 63 thousand, a rise of 13 on 50. That is , so 26%.
Question 12
From the same graph: in how many years were the unsold units more than 10% of the units produced?
Answer. The unsold units are the gaps between the two lines: 5, 12, 5, 7, 8 and 14 thousand. 10% of each year's production is 5, 6, 5.5, 7, 8 and 9. The gap is bigger only in 2019 (12 against 6) and 2023 (14 against 9). In 2018, 2021 and 2022 it is exactly 10%, which is not more than 10%. So the answer is 2 years.
Question 13
The histogram shows the marks scored by 150 students in a test.
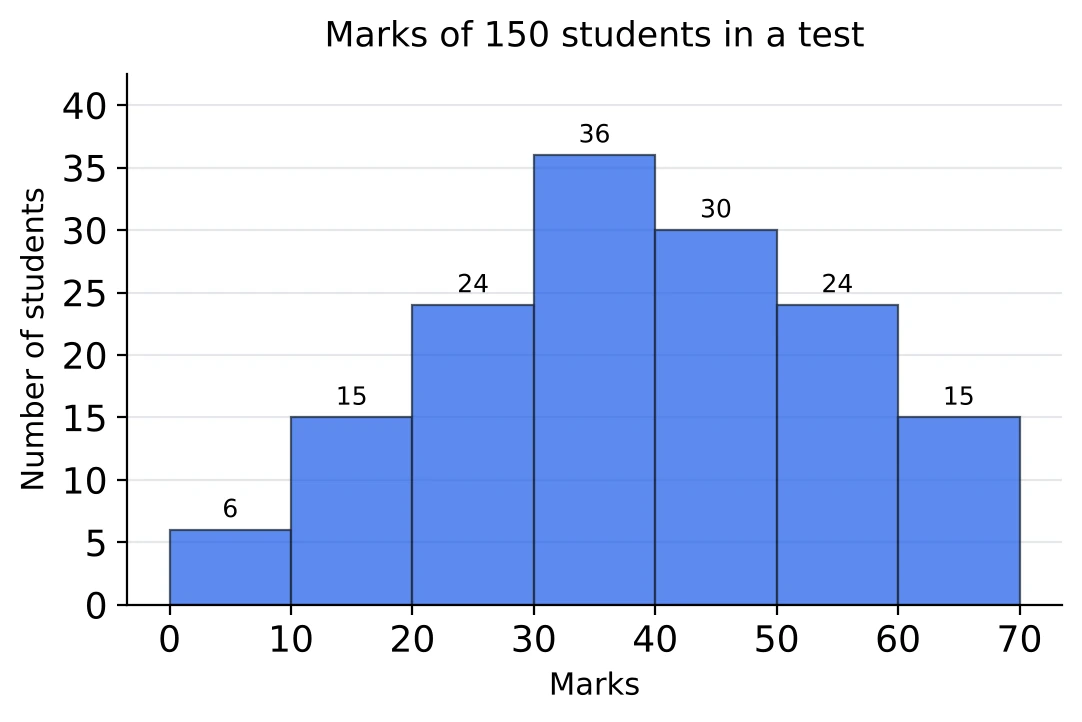
How many students scored at least 40 marks?
Answer. At least 40 means the bars from 40 onwards: the classes 40 to 50, 50 to 60 and 60 to 70. They hold 69 students.
Question 14
From the same histogram: what percentage of the students scored less than 30?
Answer. The first three bars hold students, and . So 30% scored less than 30.
Question 15
From the same histogram: what is the ratio of the number of students who scored from 30 to 50 to the number who scored from 50 to 70?
Answer. From 30 to 50 there are students, and from 50 to 70 there are . The ratio is , and after dividing both by 3 it is 22 : 13.
Question 16
The pie chart shows how the 4,800 students of a college are divided among six courses, and the table gives the ratio of boys to girls in each course.
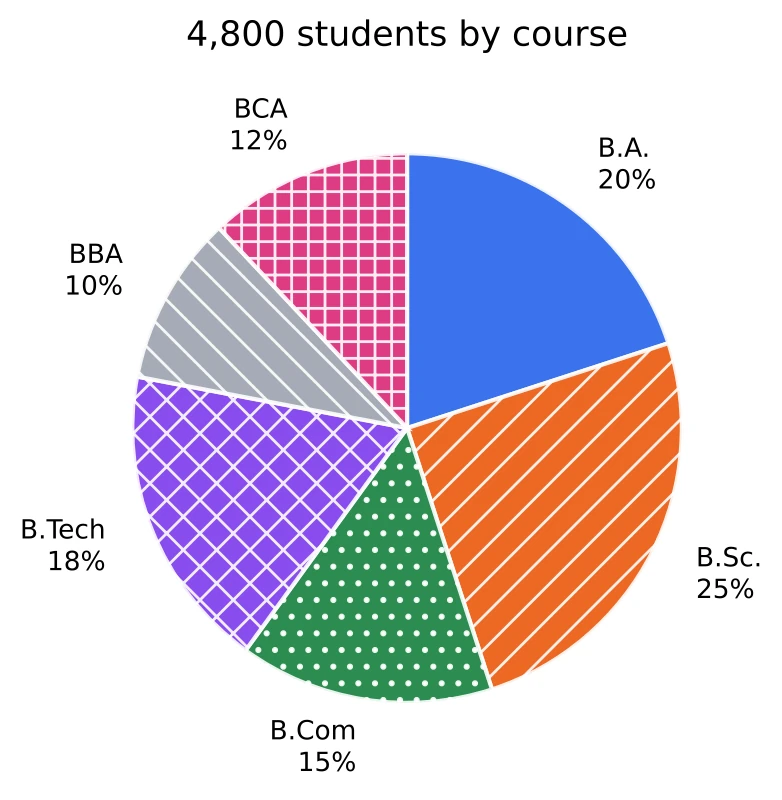
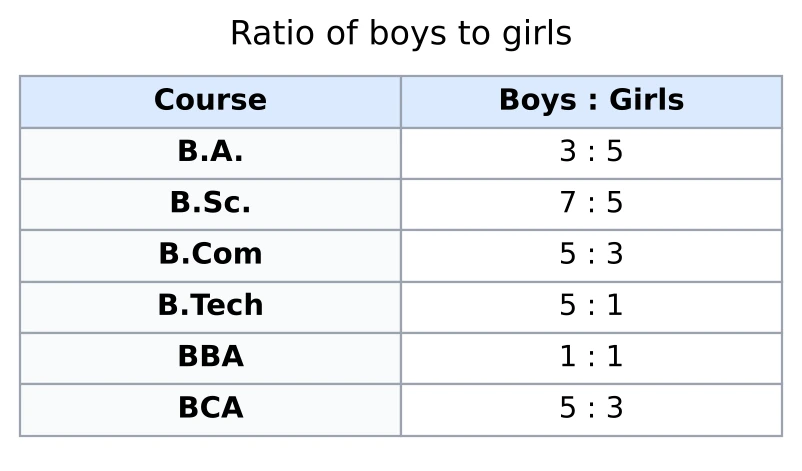
How many girls study B.Sc.?
Answer. B.Sc. has 25% of 4,800, which is 1,200 students. Boys and girls are in the ratio 7 : 5, so girls are of 1,200, that is 500 girls.
Question 17
From the same two charts: how many boys study B.Com and BCA together?
Answer. B.Com has 15% of 4,800 = 720 students and BCA has 12% = 576. Both courses have boys and girls in the ratio 5 : 3, so I can add the students first: boys are of , which is 810 boys.
Question 18
From the same two charts: the number of girls in B.A. is what percent more than the number of girls in B.Sc.?
Answer. B.A. has 20% of 4,800 = 960 students, and girls are of them, which is 600. B.Sc. has 500 girls (Question 16). So B.A. has 100 more girls, on a base of 500: 20% more.
Question 19
The table shows the sales of pens, pencils and erasers by a shop over four months. Some entries are missing and marked '?'. The average monthly sale of pens over the four months is 270.
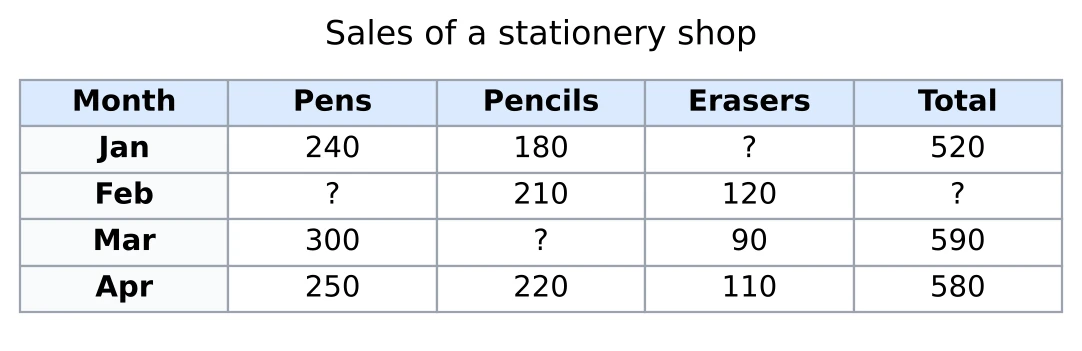
How many pens were sold in February?
Answer. I use deviations from the average, 270. January is , March is and April is , which add up to . All four deviations must add up to zero, so February is : the shop sold 290 pens. Check: .
Question 20
From the same table: in March, the sale of pencils was what percent less than the sale of pens?
Answer. March's total is 590, so pencils were . Pens were 300, and the gap of 100 is measured on the pens: . Pencils were less than pens.
Question 21
The stacked bar graph shows the production of three car models, X, Y and Z, by a company (in thousands) from 2020 to 2023.
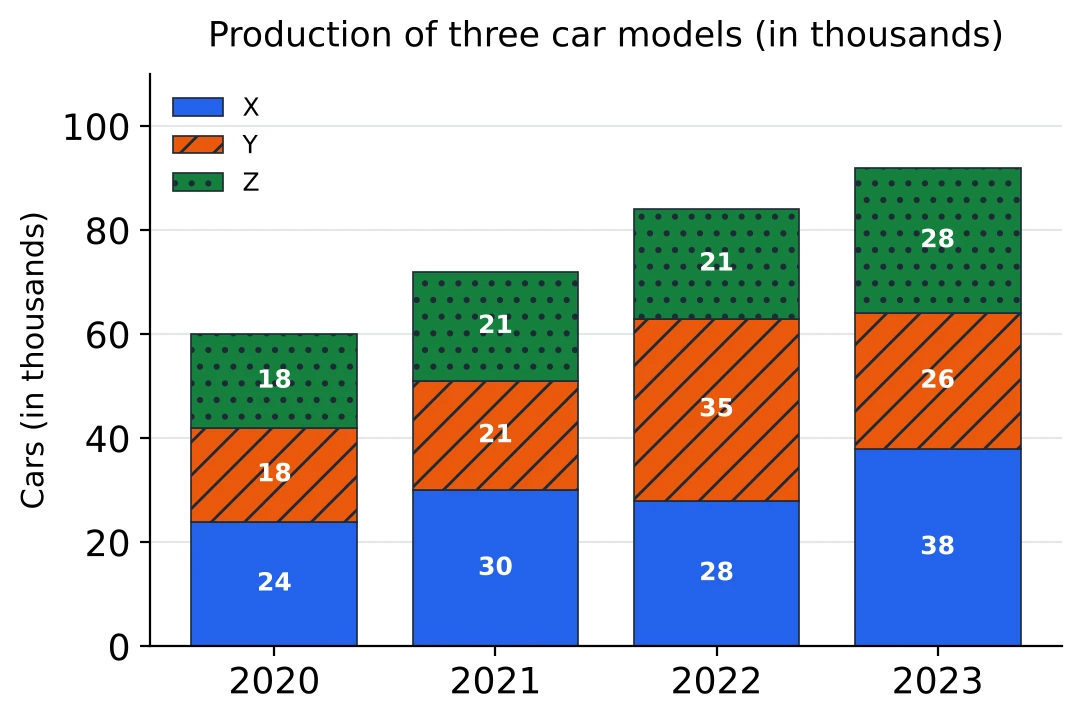
By what percentage did the company's total production rise from 2021 to 2022?
Answer. Each total is the sum of the three parts of a bar: thousand in 2021 and thousand in 2022. The rise is 12 on 72, which is , so .
Question 22
From the same graph: over the four years, the total production of model X is what percent more than the total production of model Y?
Answer. X: thousand. Y: thousand. X is compared with Y, so Y's 100 is the base, and X is 20% more.
Question 23
From the same graph: in which year was model Z's share of the total production the highest?
Answer. Z's shares: 2020 , 2021 , about 29.2%, 2022 , and 2023 . The last one is close to 30%, so I cross-multiply 2023 against 2020: and . So 2023 is higher, by a small margin.
Question 24
The bar graph shows the number of students from five schools who appeared in an exam, and the line graph shows the percentage of them who passed.
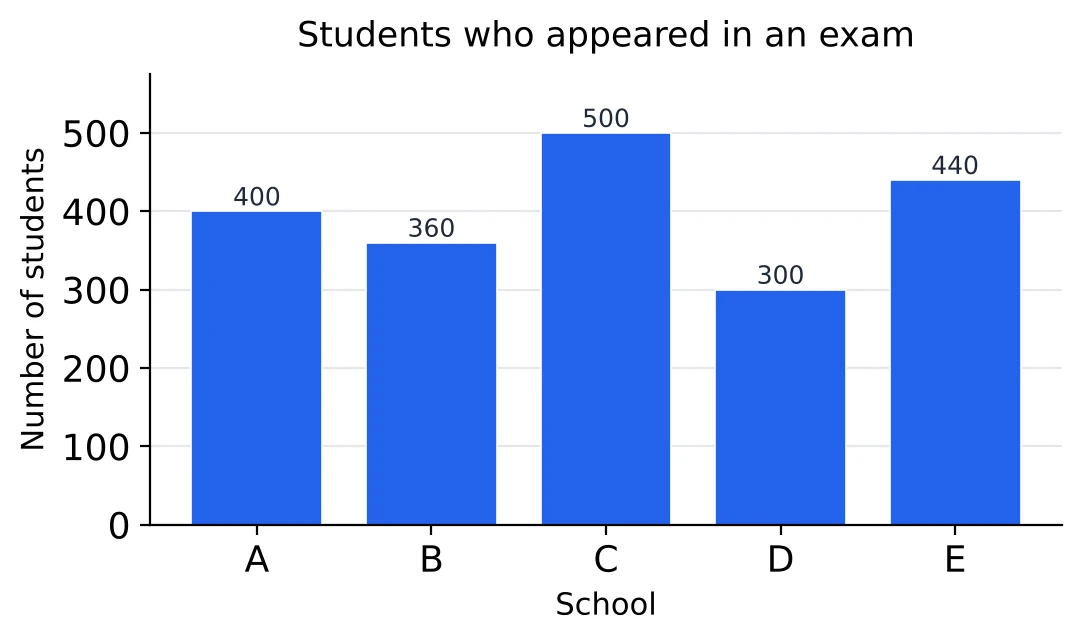
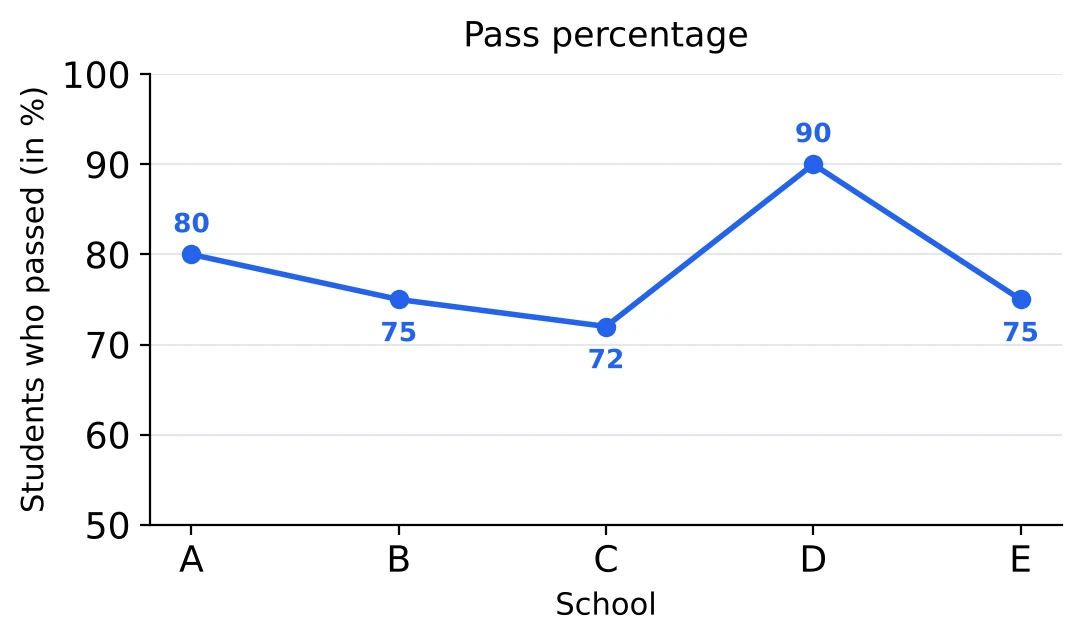
Which school had the largest number of students who passed?
Answer. For each school, the number passed is the number who appeared times the pass percentage: A , B , C , D and E . So the answer is C, even though D has the highest pass percentage.
Question 25
From the same two graphs: how many students failed in schools A and B together?
Answer. A's failures are 20% of 400 = 80, and B's are 25% of 360 = 90. Together, 170 students failed.
Question 26
From the same two graphs: what was the pass percentage of the five schools taken together?
Answer. From Question 24, the students who passed add up to . The students who appeared add up to . So the pass percentage is 77.5%. The plain average of the five percentages is 78.4%, which is not the answer, because the schools have different numbers of students.
Question 27
The frequency polygon shows the ages of 100 patients who visited a clinic on one day. Each point is plotted at the middle of its age group.
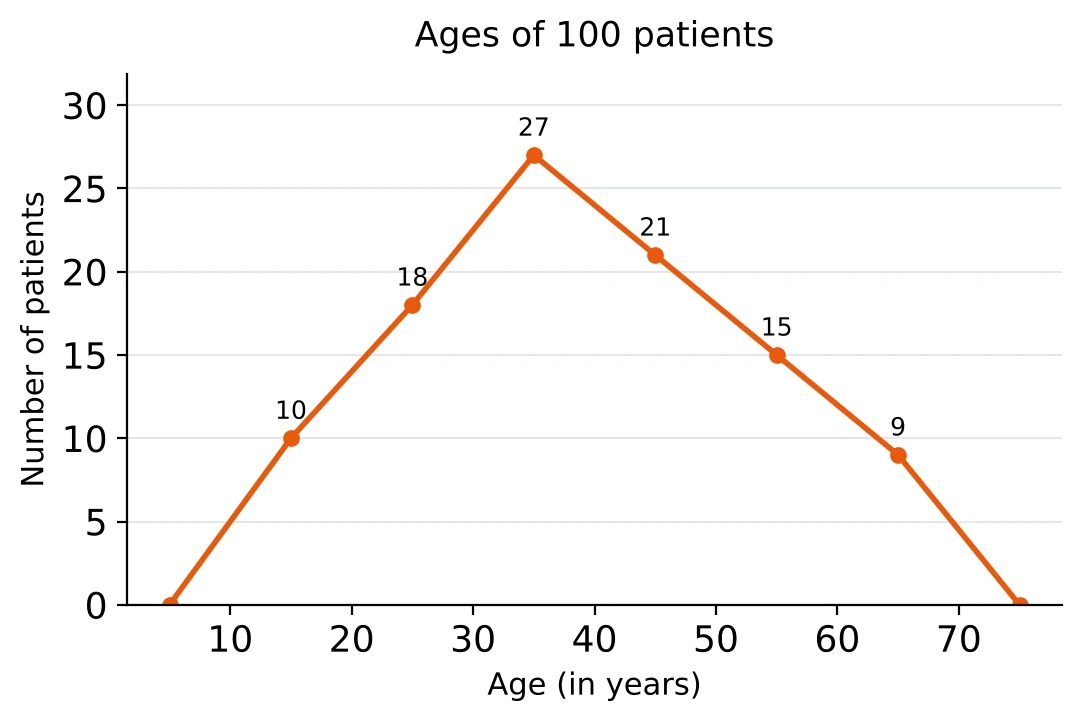
How many patients were 30 years or older but younger than 50?
Answer. The points at 35 and 45 stand for the age groups 30 to 40 and 40 to 50. They read 27 and 21, so there were 48 patients.
Question 28
From the same polygon: what percentage of the patients were 50 or older?
Answer. The points at 55 and 65 read 15 and 9, so 24 patients out of 100 were 50 or older, which is 24%. The points at 5 and 75 only close the polygon at zero; they are not age groups with patients in them.
Question 29
[Tier 2] The histogram shows the marks of 80 students. The classes have different widths, so the height of each bar is the number of students per 10 marks.
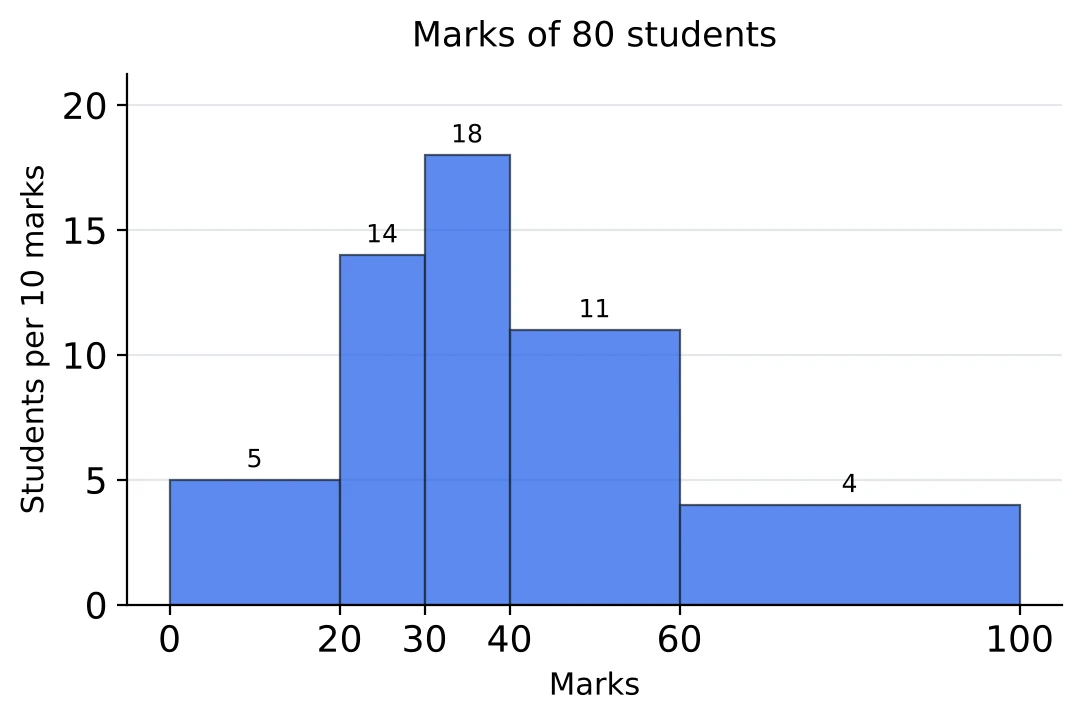
How many students scored from 40 to 60?
Answer. The class 40 to 60 is 20 marks wide, twice the standard width of 10. Its height is 11 students per 10 marks, so it holds 22 students. Reading the height straight off as the frequency gives only 11.
Question 30
[Tier 2] From the same histogram: what percentage of the students scored 40 or more?
Answer. The class 40 to 60 holds 22 students (Question 29). The class 60 to 100 is 40 marks wide, four times the standard width, so it holds . That is 38 students out of 80, and , which is 47.5%. The total checks: the class 0 to 20 holds , and .