
Reading a Percentage Pie Chart
A pie chart is a circle cut into sectors, one for each part of a whole. The bigger a part's share, the bigger its sector. In a percentage pie chart each sector is labelled with its share of the total, and the labels add up to 100%.
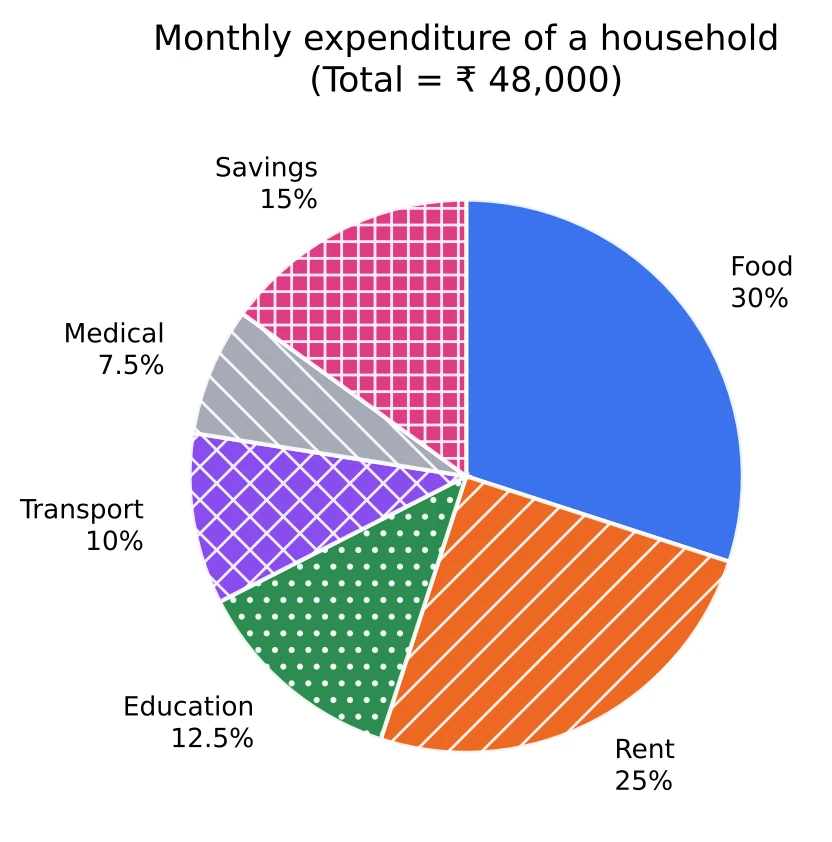
This household spends ₹ 48,000 in a month. The amount for any head is that head's percentage of the total:
- Food: , so ₹ 14,400.
- Education: 12.5% is , and , so ₹ 6,000.
- Medical: 7.5% is half of 15%. Savings at 15% come to ₹ 7,200, so medical costs ₹ 3,600.
When several questions are asked on one chart, find 1% of the total once. Here 1% of ₹ 48,000 is ₹ 480, so Food is and Rent is .
Two or more sectors together. Add the percentages first and multiply once. Food and Rent together take 55%, which is , so ₹ 26,400.
Where the total comes from. It may be printed in the title, written under the chart, or given only in the question. If no total is given anywhere, you can still answer questions about shares and ratios (Rent : Savings = 25 : 15 = 5 : 3), but not about amounts.
Before you start, add the percentages. If they come to less than 100, a sector is missing or a label has been misread.
These fractions save time on every pie chart: , , , , , . The full list is in Chapter 3.
Degree Pie Charts
In a degree pie chart each sector is labelled with its central angle, the angle it makes at the centre of the circle. The whole circle is 360°, so the angles add up to 360°.
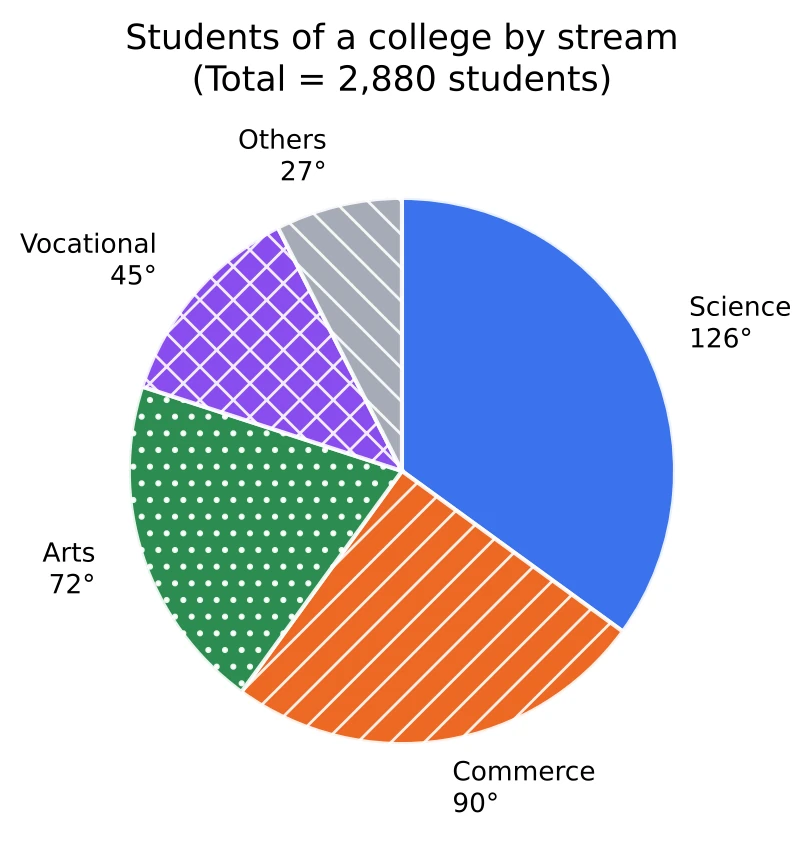
A sector's share of the whole is its angle out of 360:
This college has 2,880 students. For Commerce, , and a quarter of 2,880 is 720. For Science, .
That last line shows the faster route. One degree stands for students, so every sector is its angle times 8: Arts has students, Vocational and Others . Work out the value of 1° once and use it for every question on the chart.
Cancel before you multiply. The usual angles are easy fractions of the circle:
| Angle | 18° | 30° | 36° | 45° | 54° | 60° | 72° | 90° | 108° | 120° |
|---|---|---|---|---|---|---|---|---|---|---|
| Part of the circle |
So 54° of a total of 2,400 is , with no long division.
Difference of two sectors. Subtract the angles first. Science has degrees more than Arts, which is students more.
For a ratio the total is not needed at all: Science : Arts .
Converting Between Degrees and Percentages
The whole is 100% and it is also 360°, so
- Percentage to angle: multiply by 3.6.
- Angle to percentage: multiply by (that is, divide by 3.6).
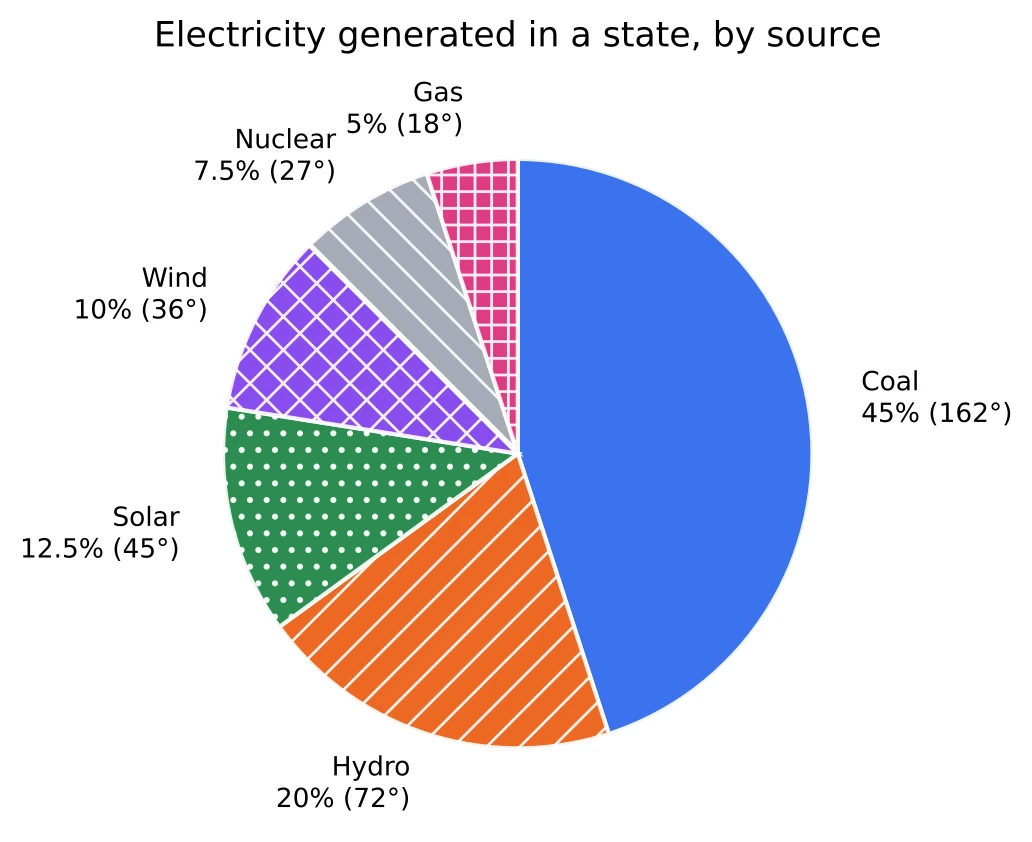
Each sector in this chart carries both labels. Coal has 45%, so its angle is . Nuclear has 27°, so its share is .
To multiply by 3.6 in your head, multiply by 4 and take away a tenth of the result. For 17.5%: , and , so the angle is 63°.
| Percentage | 5% | 10% | 12.5% | 15% | 20% | 25% | 30% | 40% | 50% |
|---|---|---|---|---|---|---|---|---|---|
| Angle | 18° | 36° | 45° | 54° | 72° | 90° | 108° | 144° | 180° |
Two units in one question. The chart may be in degrees while the options are in percentages, or the other way round. Convert once, at the start. An angle of 81° is ; a share of 32% is .
Differences convert the same way. Two sectors that differ by 7.5 percentage points differ by . Hydro (20%) and Solar (12.5%) in the chart differ by exactly that: 72° against 45°.
You never need to turn degrees into a percentage just to find an amount, because works directly. Convert only when the question asks for the other unit.
[SSC Tip] An option that repeats the chart's number with the other unit (54% when the chart says 54°) is put there for the student who did not convert. 54° is only 15%.
Finding a Missing Sector
The sectors fill the whole circle, so a sector left unlabelled can be found by subtraction:
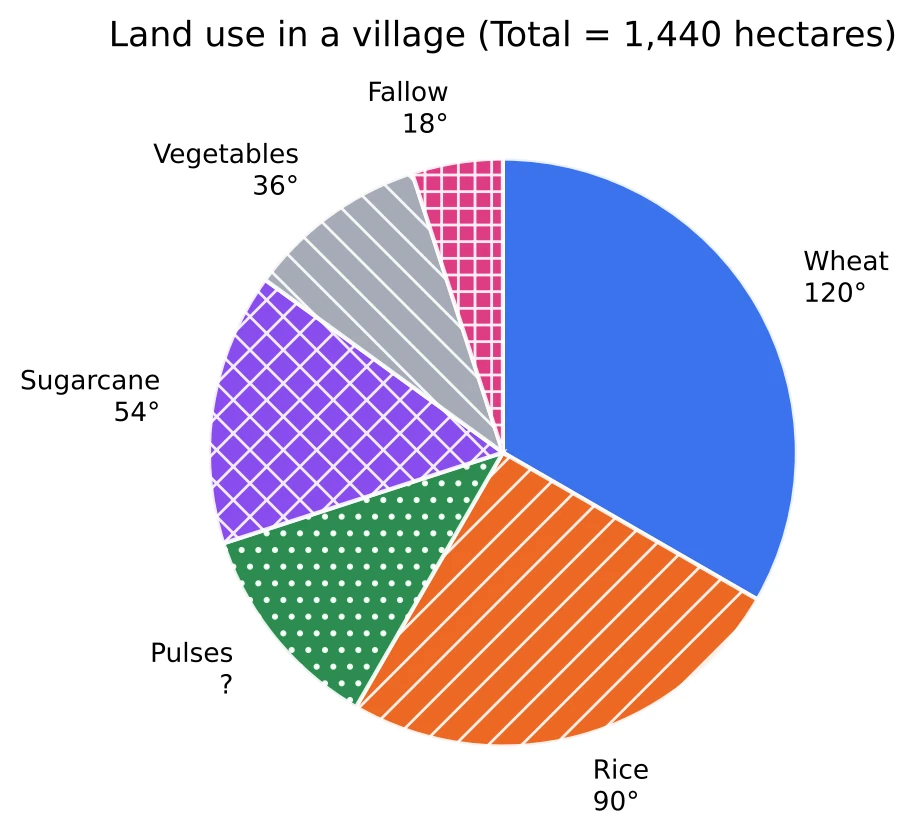
In this chart the known angles add to , so Pulses have . The village has 1,440 hectares, so 1° stands for hectares, and pulses are grown on hectares.
In a percentage chart it works the same way. If four sectors are 22%, 18%, 25% and 15%, the fifth is .
Sectors given as expressions. Sometimes the angles are written in terms of an unknown. Suppose five sectors are , , , and degrees. Then , so , and the sectors are 54°, 72°, 90°, 108° and 36°. When a sector is written as, say, , keep the 15: it is added to the known angles before you solve.
One sector described through another. If Rice gets 1.5 times the angle of Pulses and the two together take 150°, then Pulses take and Rice takes 90°.
One value known, but not the total. If you are told that Wheat (120°) covers 480 hectares, then 1° is 4 hectares and the whole village is hectares. The value of one sector together with its angle is enough to find every other sector.
Comparing Two Sectors: Difference, Ratio and Percentage
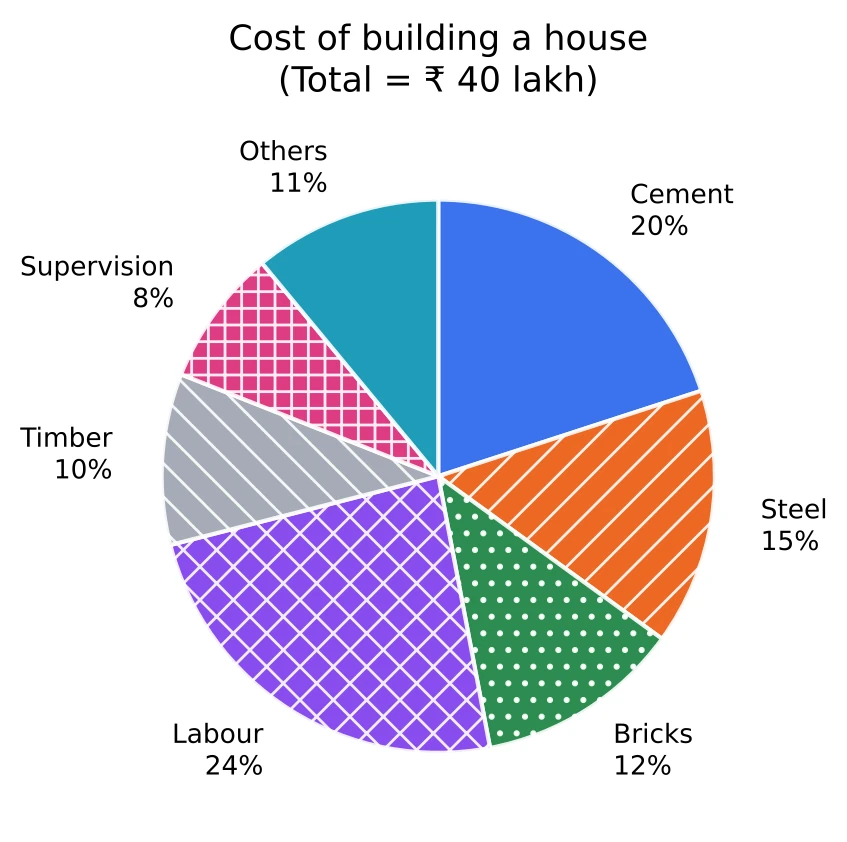
The house above costs ₹ 40 lakh in all.
Difference. Subtract the percentages, then multiply by the total once. Labour (24%) costs more than Steel (15%) by 9% of ₹ 40 lakh, which is , so ₹ 3.6 lakh. Finding both amounts and then subtracting gives the same answer with twice the work.
Ratio. The total cancels, so use the percentages (or the angles) straight away: Steel : Labour . The amounts, ₹ 6 lakh and ₹ 9.6 lakh, are in the same ratio.
A as a percentage of B. Again the total cancels. Supervision as a percentage of Cement is .
By what percent is A more (or less) than B? Measure the difference against the value that comes after than:
- Labour is more than Cement by .
- Cement is less than Labour by .
The difference is the same 4 in both lines; only the base changes. Take the base from the words of the question, not from whichever number is larger.
Percentage points. Labour's share is 4 percentage points more than Cement's (24% against 20%), but Labour costs 20% more. A question that asks 'by how many percentage points' wants the plain difference, 4; one that asks 'by what percent' wants 20% (see Chapter 3).
Of the total, or of a part? Read the question for the base. 'Steel and Bricks together are what percent of the total cost?' is just . 'Steel is what percent of the cost of Steel and Bricks together?' is .
The Angle for a Given Value, and the Total from One Sector
Some pie charts show actual values, and the question asks for an angle or a percentage.
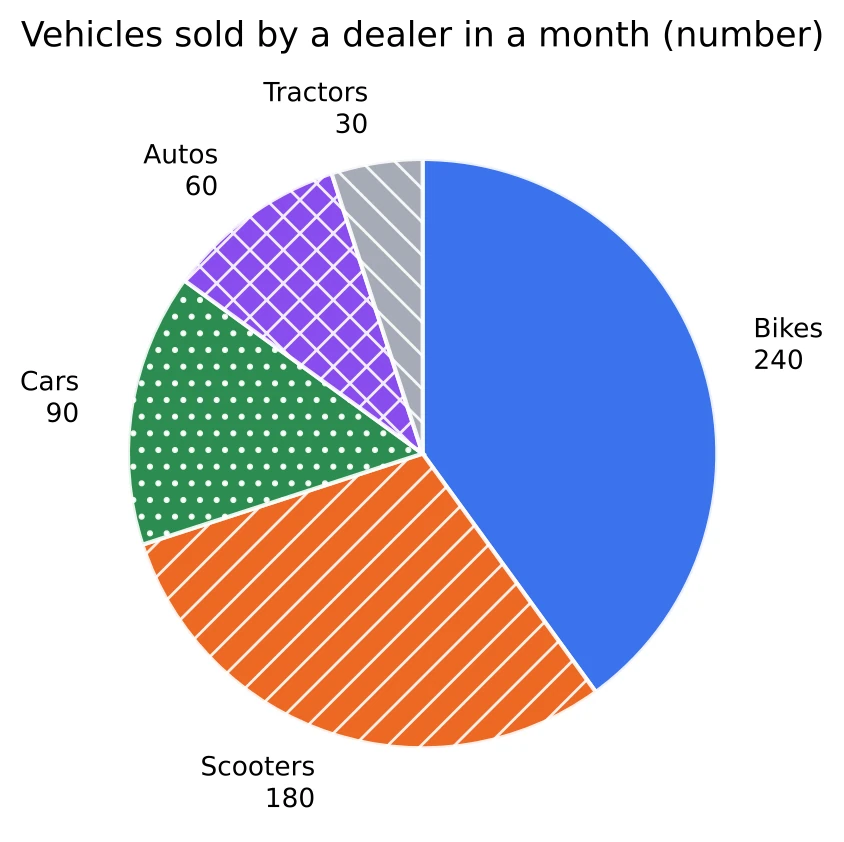
The dealer sold vehicles. Bikes take and Cars take . Simplify the fraction first: , and of 360 is 54.
There is a constant here too. Each vehicle is worth , so Scooters get and Autos .
When the total changes. Suppose the dealer had sold 120 more cars. The total becomes 720, and Cars take . Every other sector shrinks, because the circle is still 360°. Working with the old total of 600 would give 126°, which is wrong.
The total from one sector. In a degree pie chart of a family's spending, suppose Transport has 54° and costs ₹ 10,800 a month. Then 1° stands for rupees, the whole budget is , that is ₹ 72,000, and a sector of 81° is worth , or ₹ 16,200.
You don't always need the total. Values are in the same ratio as angles, so the 81° sector is worth directly.
Two Pie Charts with Different Totals
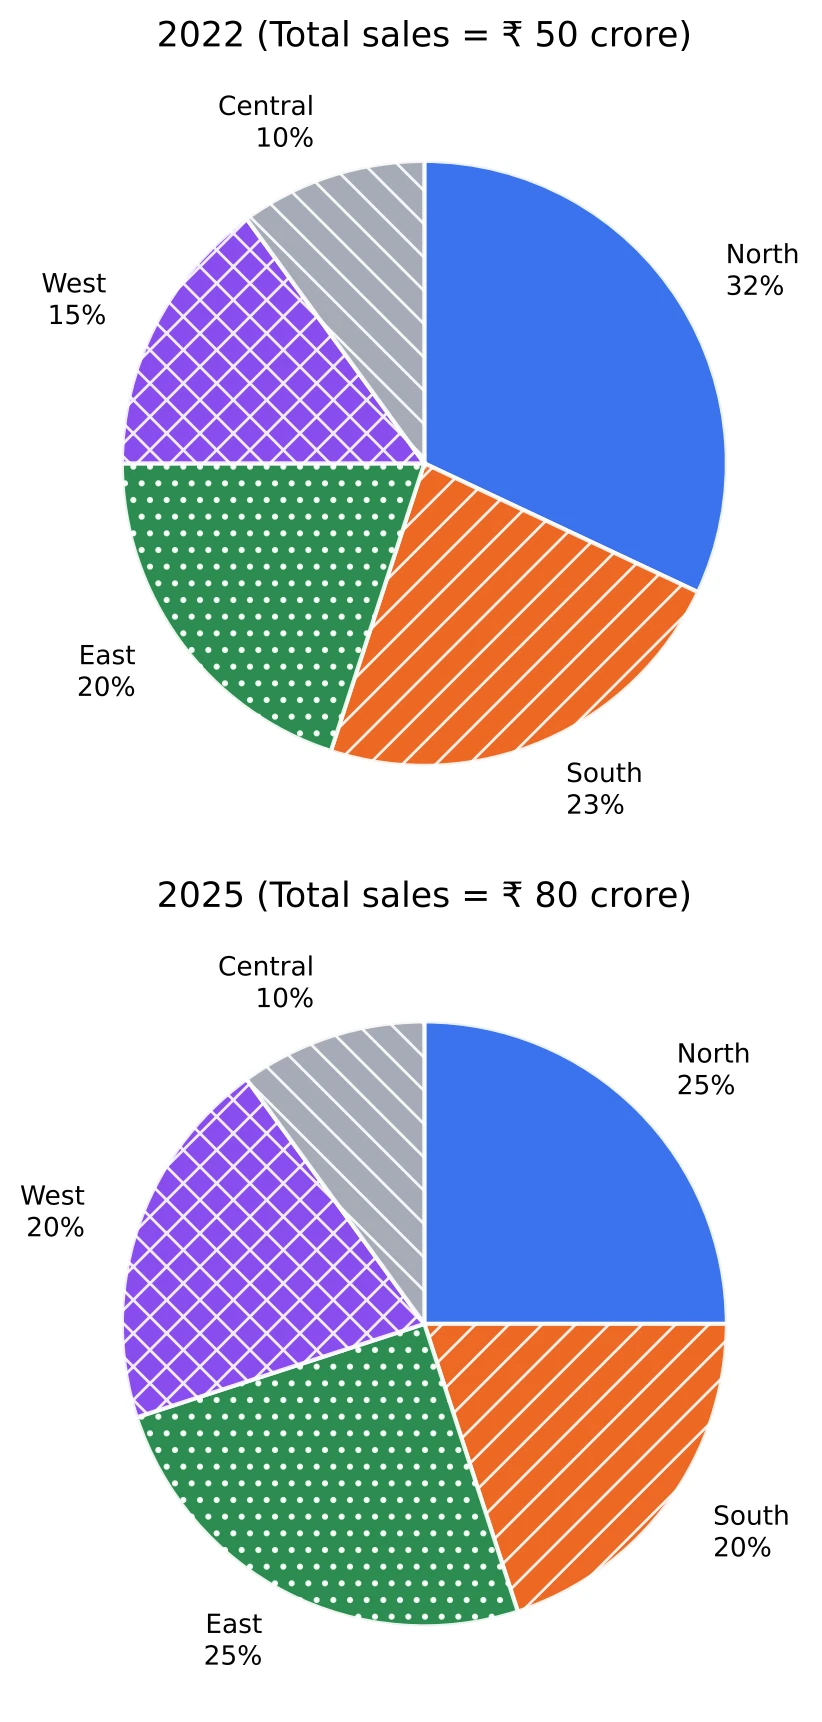
The two charts show how a company's sales were split among five regions in 2022, when sales were ₹ 50 crore, and in 2025, when they were ₹ 80 crore.
A percentage means something only together with its own total. North's share fell from 32% to 25%, yet its sales rose:
- 2022: 32% of ₹ 50 crore = ₹ 16 crore
- 2025: 25% of ₹ 80 crore = ₹ 20 crore
A smaller slice of a bigger pie can be more money. Central kept the same 10% share in both years, but its sales went up from ₹ 5 crore to ₹ 8 crore, a rise of 60%.
The rule. Compare percentages directly only inside one chart. To compare a sector across the two charts, turn both into amounts first, or use
For North: , a rise of 25%. For West: , a rise of , the largest of the five regions.
Questions on such a pair ask for:
- the change in one sector from one year to the other, as an amount or a percentage;
- the number of sectors whose value rose or fell;
- the ratio of one sector in one year to a sector in the other year.
In all three the wrong options are worked from the percentages alone, as if the two totals were equal.
[SSC Tip] If the question names two years or two charts, write the amounts for the sectors it asks about before you compare anything. It takes a few seconds and keeps you clear of the options worked from the shares alone.
A Pie Chart with a Table
A pie chart may give the size of each part while a table splits each part further, for example into men and women. Work in two steps: take the part from the pie chart, then split it using the table.
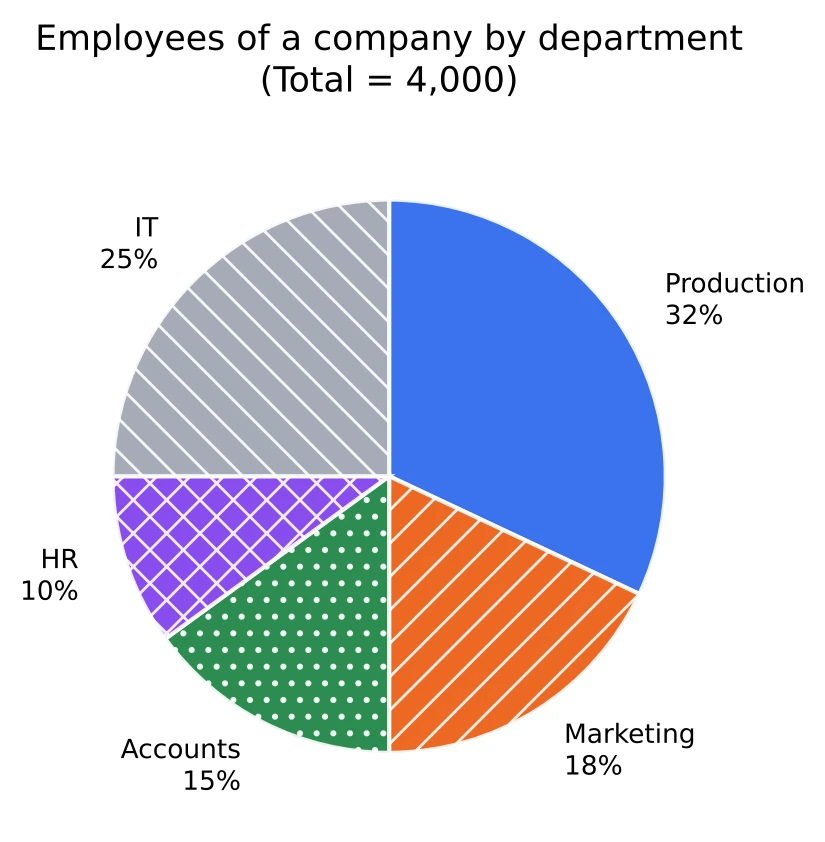
This company has 4,000 employees, divided among its departments as shown. The table gives the ratio of men to women in each department.
| Department | Production | Marketing | Accounts | HR | IT |
|---|---|---|---|---|---|
| Men : Women | 3 : 1 | 5 : 1 | 2 : 1 | 1 : 1 | 2 : 3 |
Women in Production. Production has 32% of 4,000, that is 1,280 employees. Women are 1 part out of , so there are women.
Men in IT. IT has 25% of 4,000, that is 1,000 employees, and men are 2 parts out of 5: .
A total across departments. Women in the five departments: Production 320, Marketing , Accounts , HR , IT . That is 1,440 women. The women of IT are of all the women, about 42%, though IT has only 25% of the staff.
That is what these sets test: the department with the biggest sector need not have the most women, and a department's share of the women is not its share of the pie. Do the two steps every time.
When the table gives percentages instead of ratios (say, 45% of the Marketing staff are graduates), the second step is a percentage of a part: 45% of 720, that is graduates in Marketing.
A Bar Graph of Totals with a Pie Chart of Shares
In a mixed set one chart gives totals and the other splits one of those totals into parts. Here the bar graph gives the yearly production of a steel plant, and the pie chart splits the 2024 production among its products.
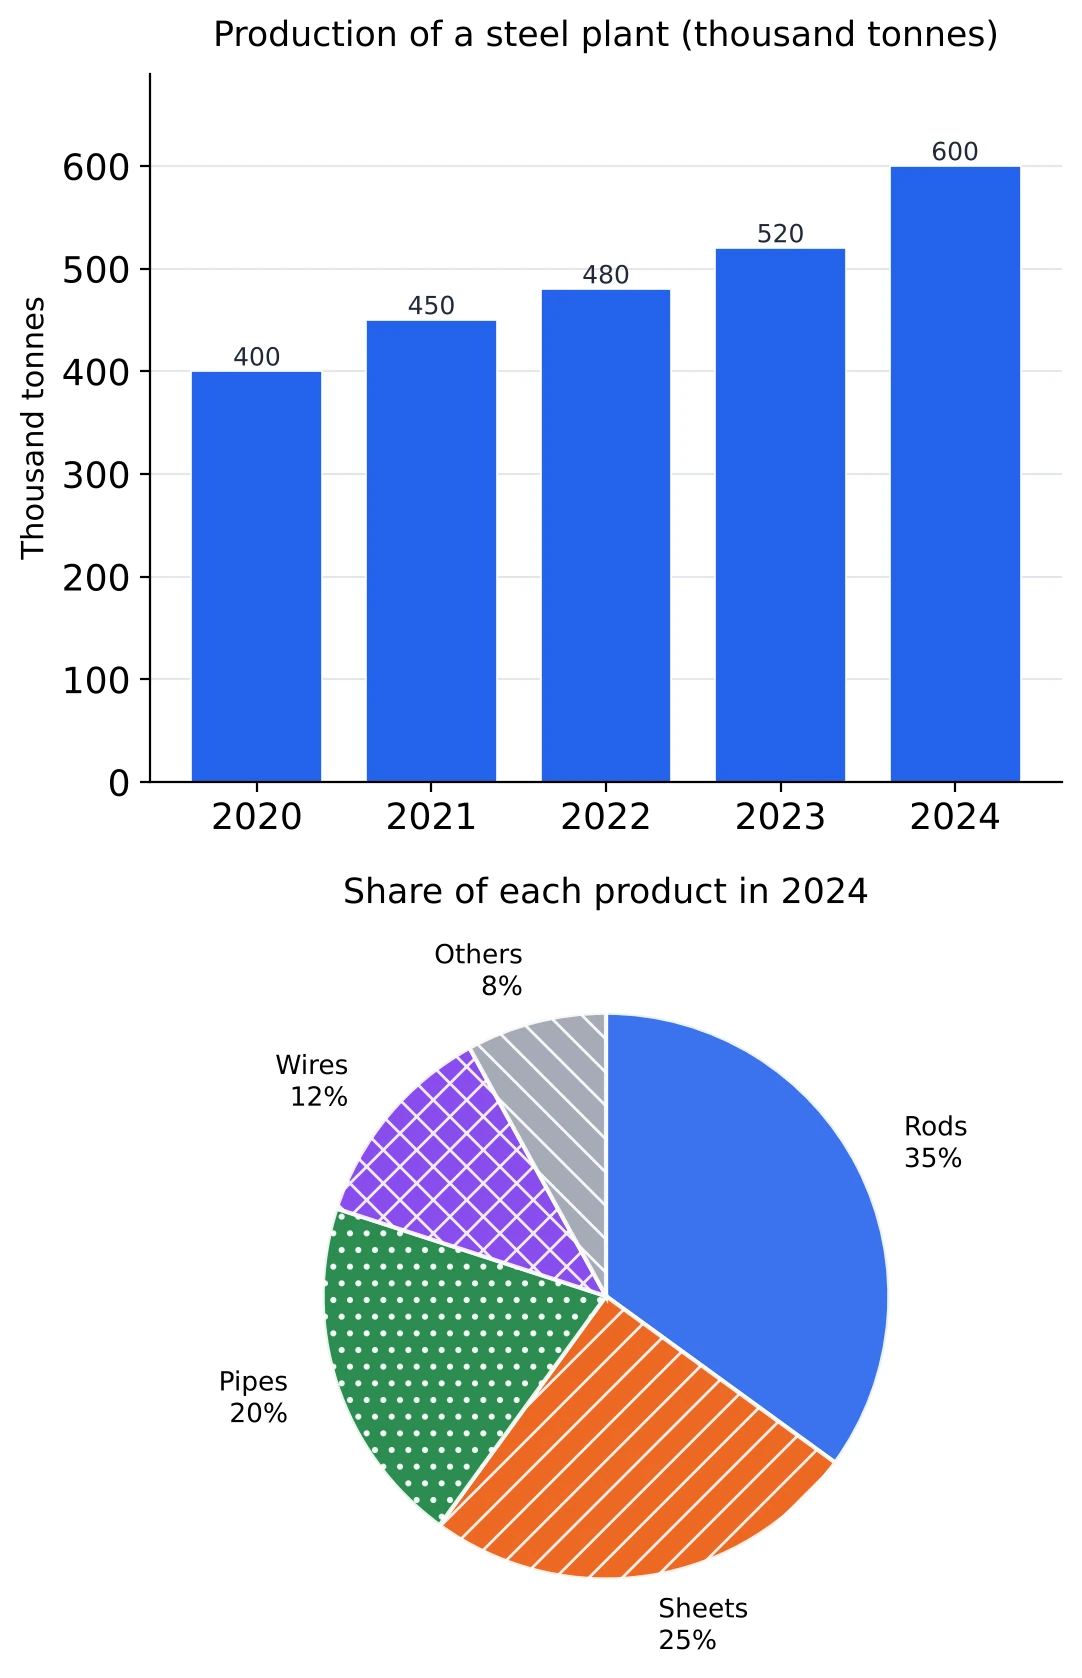
Use the right total. The pie chart is for 2024, so its percentages go with the 2024 bar, 600 thousand tonnes. Rods: 35% of 600 = 210 thousand tonnes. Pipes: 20% of 600 = 120 thousand tonnes.
Do not carry the pie to another year unless told. The pie says nothing about 2022 or 2023. If a question adds that Pipes had the same share in 2023 as in 2024, then Pipes in 2023 were 20% of 520 = 104 thousand tonnes, and they rose by in 2024.
A part of one year against the total of another. 'Wires produced in 2024 were what percent of the total production in 2020?' Wires in 2024 = 12% of 600 = 72, and .
Changes in the total. The rise in total production from 2023 to 2024 is , the same as for Pipes. That is no accident: a part that keeps the same share grows at the same rate as the total. If the question says the share is unchanged, you can take the growth of the total and skip the rest.
Questions on the bar graph alone, such as the year with the largest rise, use the methods of Bar Graphs.
Working Fast on Pie Chart Questions
A set of three or four questions on one pie chart can be done in about two minutes if the arithmetic is kept small.
- Find the unit value once. Work out 1% of the total, or the value of 1°, and multiply each sector by it.
- Keep the total for the end. For sums and differences of sectors, add or subtract the percentages (or angles) first and multiply by the total once.
- Ratios need no total, as long as both sectors are in the same chart.
- Cancel with 360 early. For , use ; then the answer is .
- Use fractions for percentages. 37.5% of 6,400 is .
- Approximate when the options are far apart. With options 410, 520, 640 and 780 for 23.7% of 2,180, take 24% of 2,200: about 528, so the answer is 520.
- Check that the data adds up. Percentages make 100 and angles make 360. If they do not, a label has been misread, or a sector is missing and has to be found first.
Read the base. Three phrases mean three different calculations:
| The question says | You work out |
|---|---|
| A is what percent of the total | A's share, read straight off a percentage chart |
| A is what percent of B | |
| A is what percent more than B |
In a degree chart, the first one needs a conversion: an 81° sector is 22.5% of the total.
Before you mark an answer, ask three questions. Did I read degrees as degrees and percentages as percentages? If two charts are involved, did I compare amounts and not shares? Is my 'more than' measured from the right base? The wrong options in these sets are built from exactly these three mistakes.
Solved Examples
Question 1
The pie chart shows how a sports club spends its annual budget of ₹ 64 lakh.
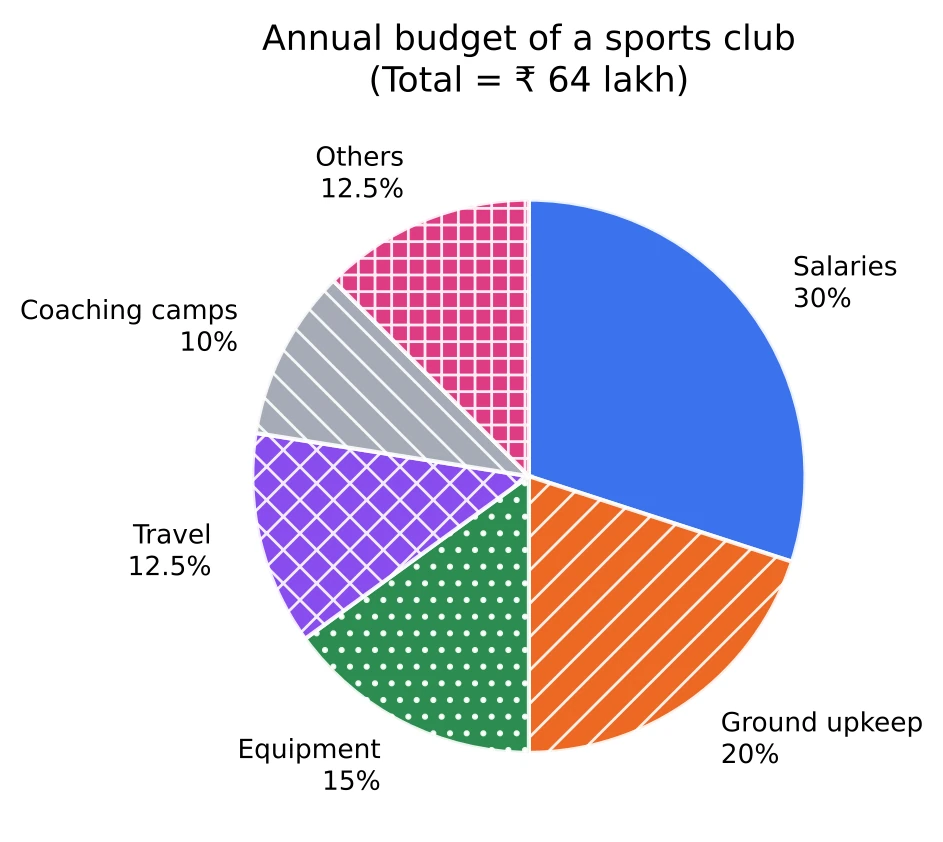
How much does the club spend on equipment? (a) ₹ 8 lakh (b) ₹ 12.8 lakh (c) ₹ 9.6 lakh (d) ₹ 6.4 lakh
Answer. Equipment has 15%, and 15% of ₹ 64 lakh is . So the club spends (c) ₹ 9.6 lakh. I find it quicker to take 10% (6.4) and add half of it (3.2).
Question 2
By how much does the spending on salaries exceed the spending on travel? (a) ₹ 11.2 lakh (b) ₹ 17.5 lakh (c) ₹ 8 lakh (d) ₹ 19.2 lakh
Answer. I subtract the percentages first: . Then 17.5% of ₹ 64 lakh is . So salaries are more by (a) ₹ 11.2 lakh. The 17.5 is a percentage and not an amount, so ₹ 17.5 lakh cannot be right.
Question 3
The spending on ground upkeep is what percent of the spending on salaries and equipment together? (a) (b) 225% (c) 35% (d)
Answer. The total cancels, so I stay with the percentages. Salaries and equipment together take of the budget, and ground upkeep takes 20%. Then , so the answer is (d) .
Question 4
The pie chart shows the age groups of the 2,400 people who visited a museum on a Sunday. The figures are central angles.
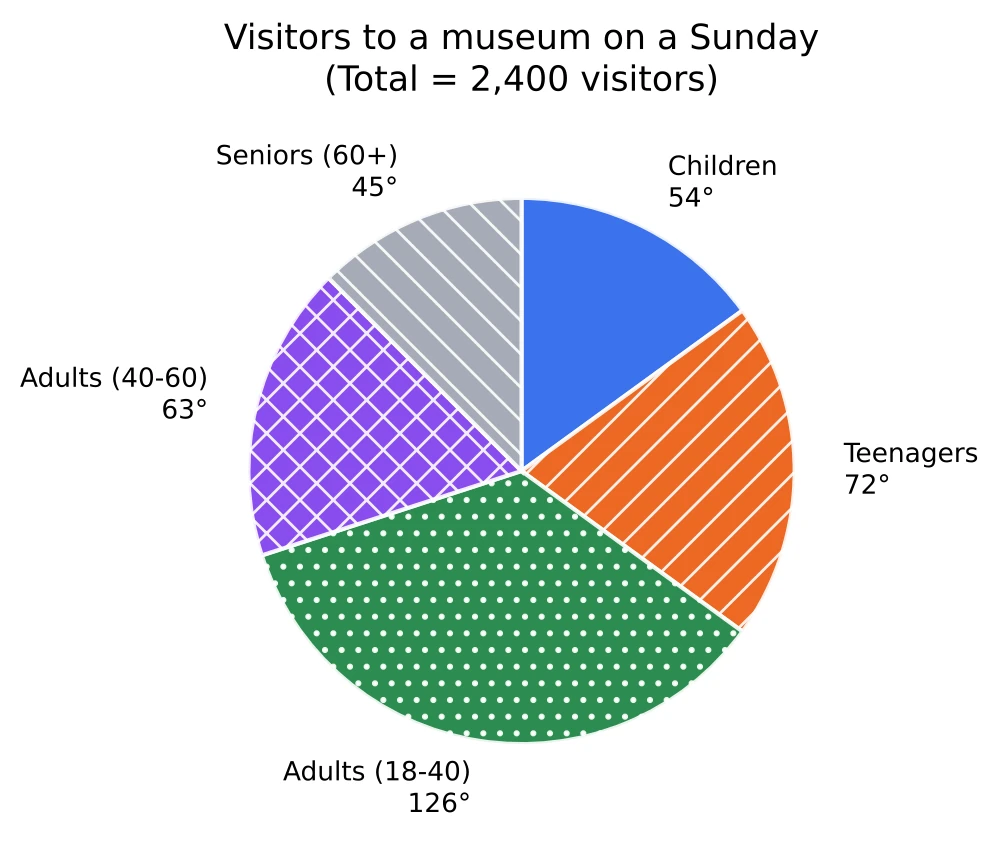
How many teenagers visited the museum? (a) 720 (b) 480 (c) 360 (d) 432
Answer. One degree here stands for visitors, which is not a whole number, so I cancel instead: , and of 2,400 is 480. So (b) 480 teenagers came.
Question 5
What percentage of the visitors were seniors? (a) 45% (b) 15% (c) 12.5% (d) 8%
Answer. To turn degrees into a percentage I multiply by : . So (c) 12.5% of the visitors were seniors. Reading 45° as 45% would make almost half the visitors seniors, which the small sector clearly does not show.
Question 6
How many more visitors were adults aged 18 to 40 than seniors? (a) 540 (b) 81 (c) 840 (d) 300
Answer. I subtract the angles first: . Then . So there were (a) 540 more adults of that age than seniors.
Question 7
A school spends a grant of ₹ 18 lakh on five heads. The pie chart shows the central angles, three of them in terms of .
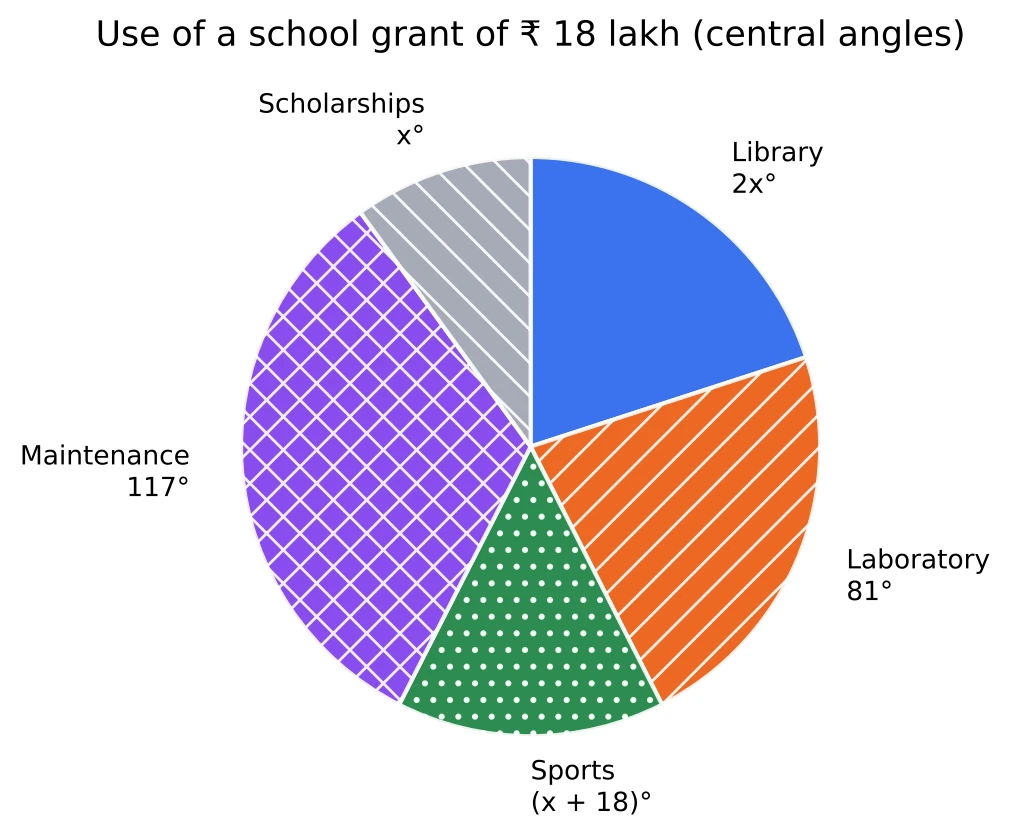
What is the value of ? (a) 40.5 (b) 54 (c) 18 (d) 36
Answer. All the angles add up to 360°: . That is , so and . The answer is (d) 36. If the 18 inside the bracket is left out, comes to 40.5, so I always copy the bracket in full.
Question 8
How much does the school spend on sports? (a) ₹ 1.8 lakh (b) ₹ 2.7 lakh (c) ₹ 3.6 lakh (d) ₹ 4.05 lakh
Answer. Sports has . Since , the amount is lakh. So the school spends (b) ₹ 2.7 lakh on sports.
Question 9
If ₹ 90,000 is moved from Maintenance to Scholarships, what will be the central angle of the Scholarships sector? (a) 41° (b) 18° (c) 54° (d) 72°
Answer. Each degree is worth ₹ 5,000, because ₹ 18 lakh spread over 360 degrees is 5,000 rupees a degree. So ₹ 90,000 is . The grant itself does not change, so Scholarships go from 36° to , which is (c) 54°.
Question 10
The pie chart shows the number of books of each subject in a school library.
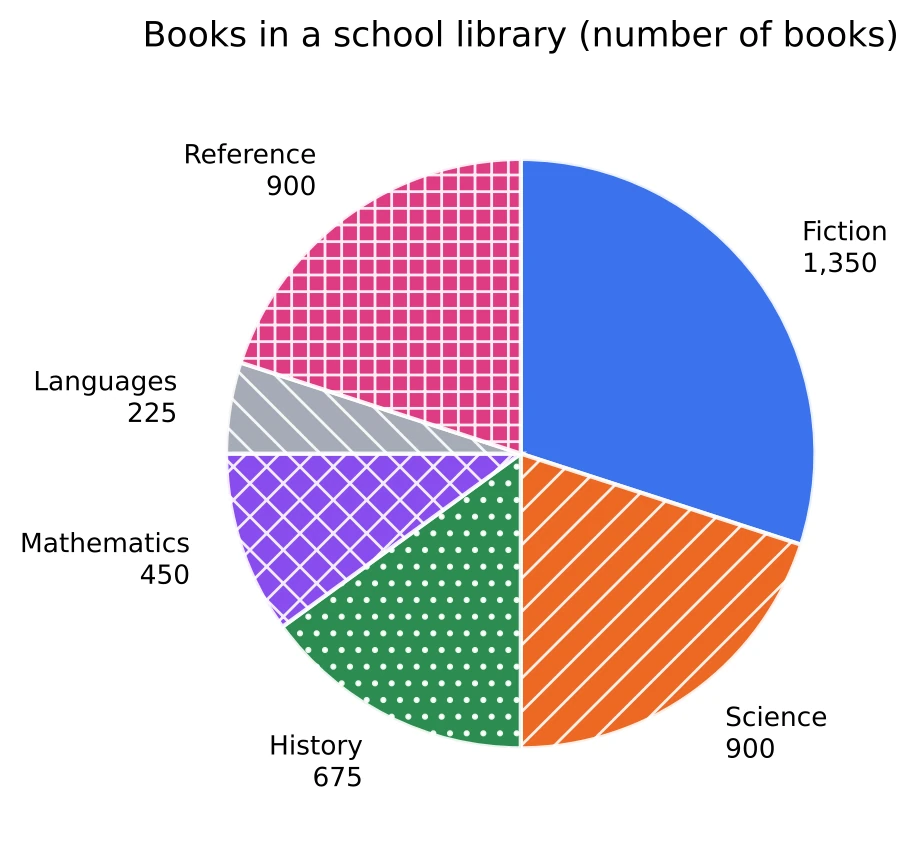
What is the central angle of the sector for History? (a) 54° (b) 15° (c) 60° (d) 72°
Answer. First the total: books. History's angle is . Since , the angle is , which is (a) 54°.
Question 11
The library adds 900 new Mathematics books and nothing else changes. What will be the central angle of the Mathematics sector? (a) 108° (b) 72° (c) 36° (d) 90°
Answer. Mathematics will have books, and the library . The new angle is , so the answer is (d) 90°. If I had kept the old total of 4,500, I would have got 108°, but the circle has to make room for the new books.
Question 12
The two pie charts show how the students admitted to an institute were spread over five courses in 2023 and in 2025. In 2023, 1,500 students were admitted; in 2025, 2,400.
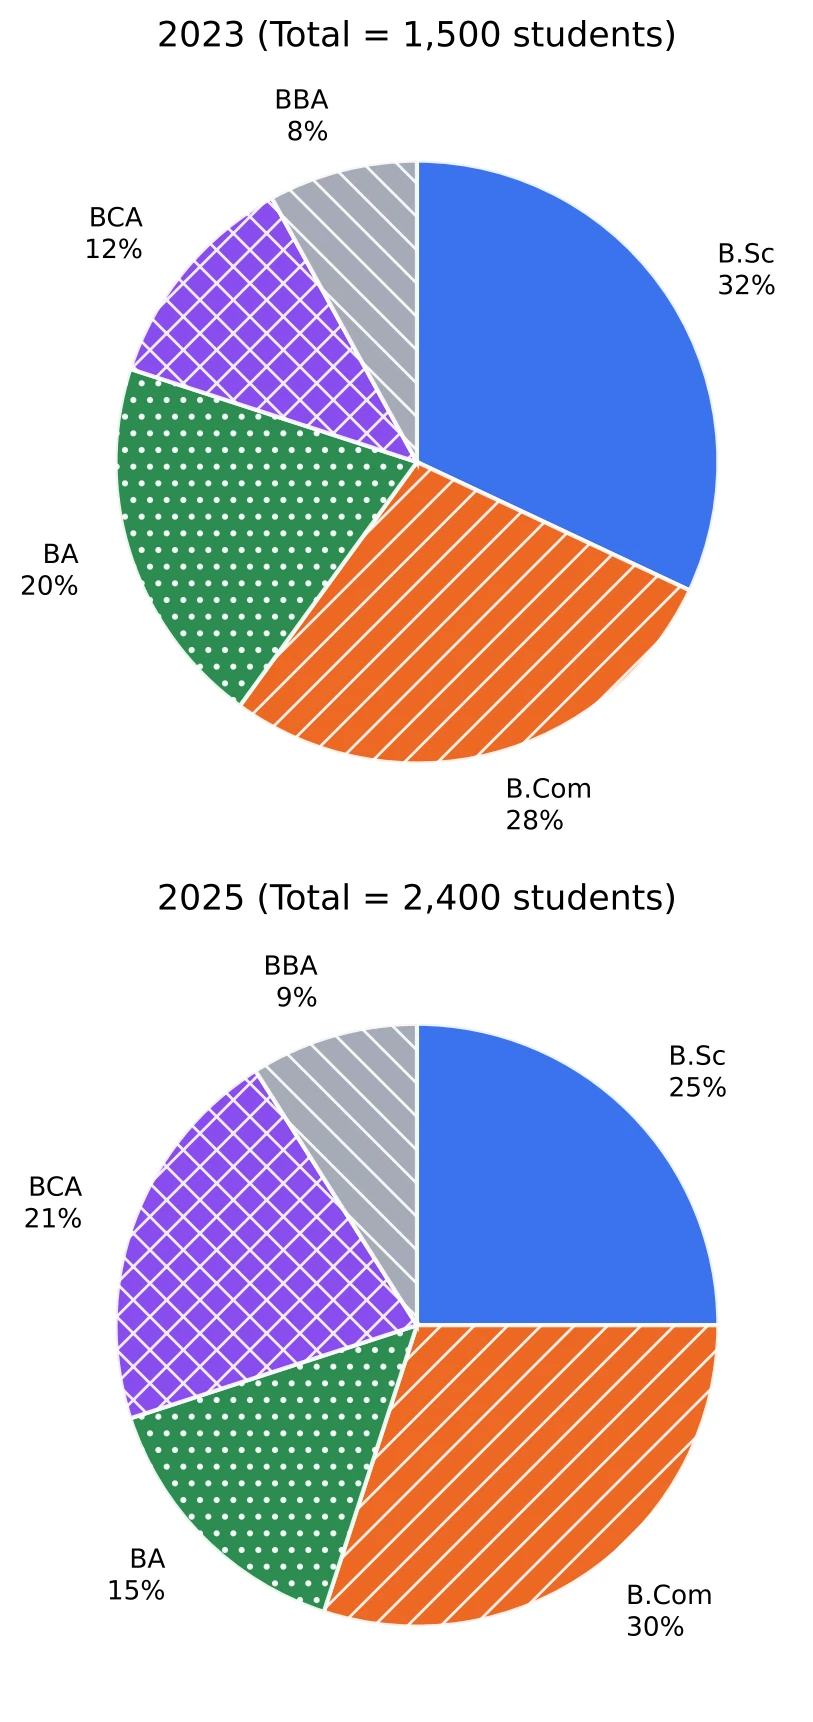
By what percentage did admissions to B.Sc rise from 2023 to 2025? (a) 60% (b) 28% (c) 25% (d) 7%
Answer. I can't compare 32% with 25% because the totals are different. In 2023, B.Sc had 32% of 1,500, that is 480 students; in 2025 it had 25% of 2,400, that is 600. The rise is 120 on 480, and . So the answer is (c) 25%. The share went down, but the number of students went up.
Question 13
In which course did the number of admissions rise by the largest percentage? (a) BCA (b) B.Com (c) BBA (d) B.Sc
Answer. I write the numbers for both years. B.Sc 480 to 600, B.Com 420 to 720, BA 300 to 360, BCA 180 to 504, BBA 120 to 216. BCA went up to almost three times its old number, and no other course even doubled. So the answer is (a) BCA. B.Com added nearly as many students as BCA (300 against 324), but on a much bigger base.
Question 14
What is the ratio of the number of BA students admitted in 2023 to the number admitted in 2025? (a) 4 : 3 (b) 3 : 4 (c) 6 : 5 (d) 5 : 6
Answer. BA had 20% of 1,500 = 300 students in 2023 and 15% of 2,400 = 360 in 2025. So the ratio is 300 : 360, which is (d) 5 : 6. Taking the shares alone, 20 : 15, would give 4 : 3, as if both years had the same total.
Question 15
The pie chart shows how the 3,600 workers of a factory are spread over its five units, and the table gives the ratio of men to women in each unit.
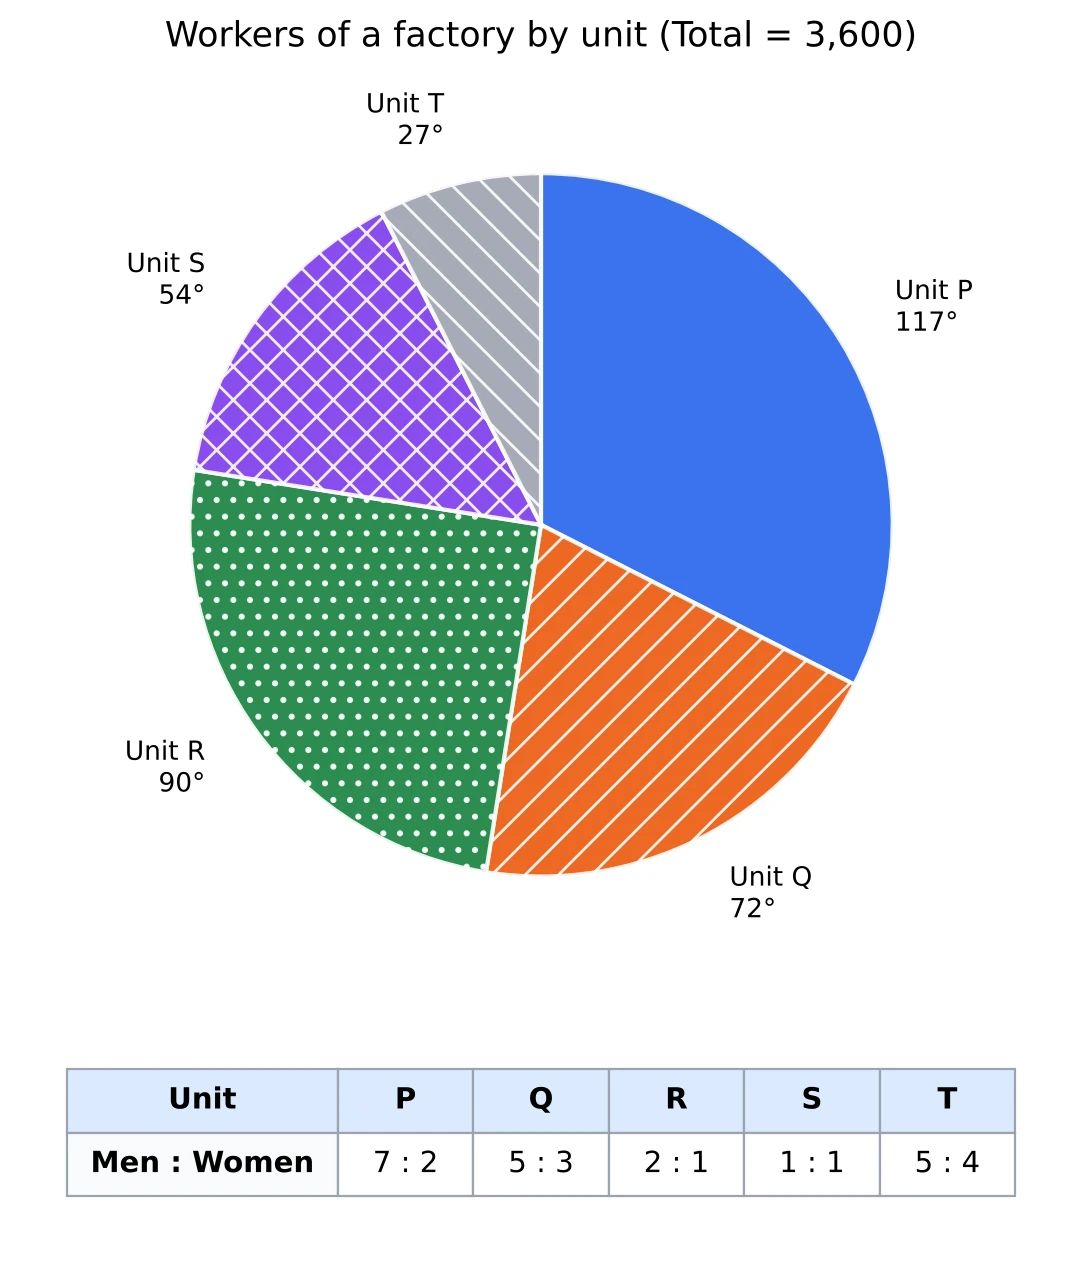
How many women work in Unit R? (a) 600 (b) 300 (c) 450 (d) 360
Answer. Unit R has workers. Men and women are in the ratio 2 : 1, so women are 1 part out of 3: . That gives (b) 300.
Question 16
The number of women in Units Q and T together is what percent of the number of men in Unit R? (a) (b) 60% (c) 65% (d) 75%
Answer. Each degree is 10 workers. Q has 720 workers and women are of them, which is 270. T has 270 workers and women are of them, which is 120. Together that is 390 women. For the bottom of the fraction I need only R's men. R has 900 workers and men are of them, which is 600. Then , so the answer is (c) 65%.
Question 17
Which unit has the largest number of women? (a) Unit R (b) Unit P (c) Unit Q (d) Unit S
Answer. I find the women in every unit: P , Q 270, R 300, S and T 120. The most is 300, in (a) Unit R. P is the biggest unit, but only 2 of every 9 workers there are women.
Question 18
The bar graph shows the total sales of a company from 2020 to 2024, and the pie chart shows how its 2024 sales were divided among its products.
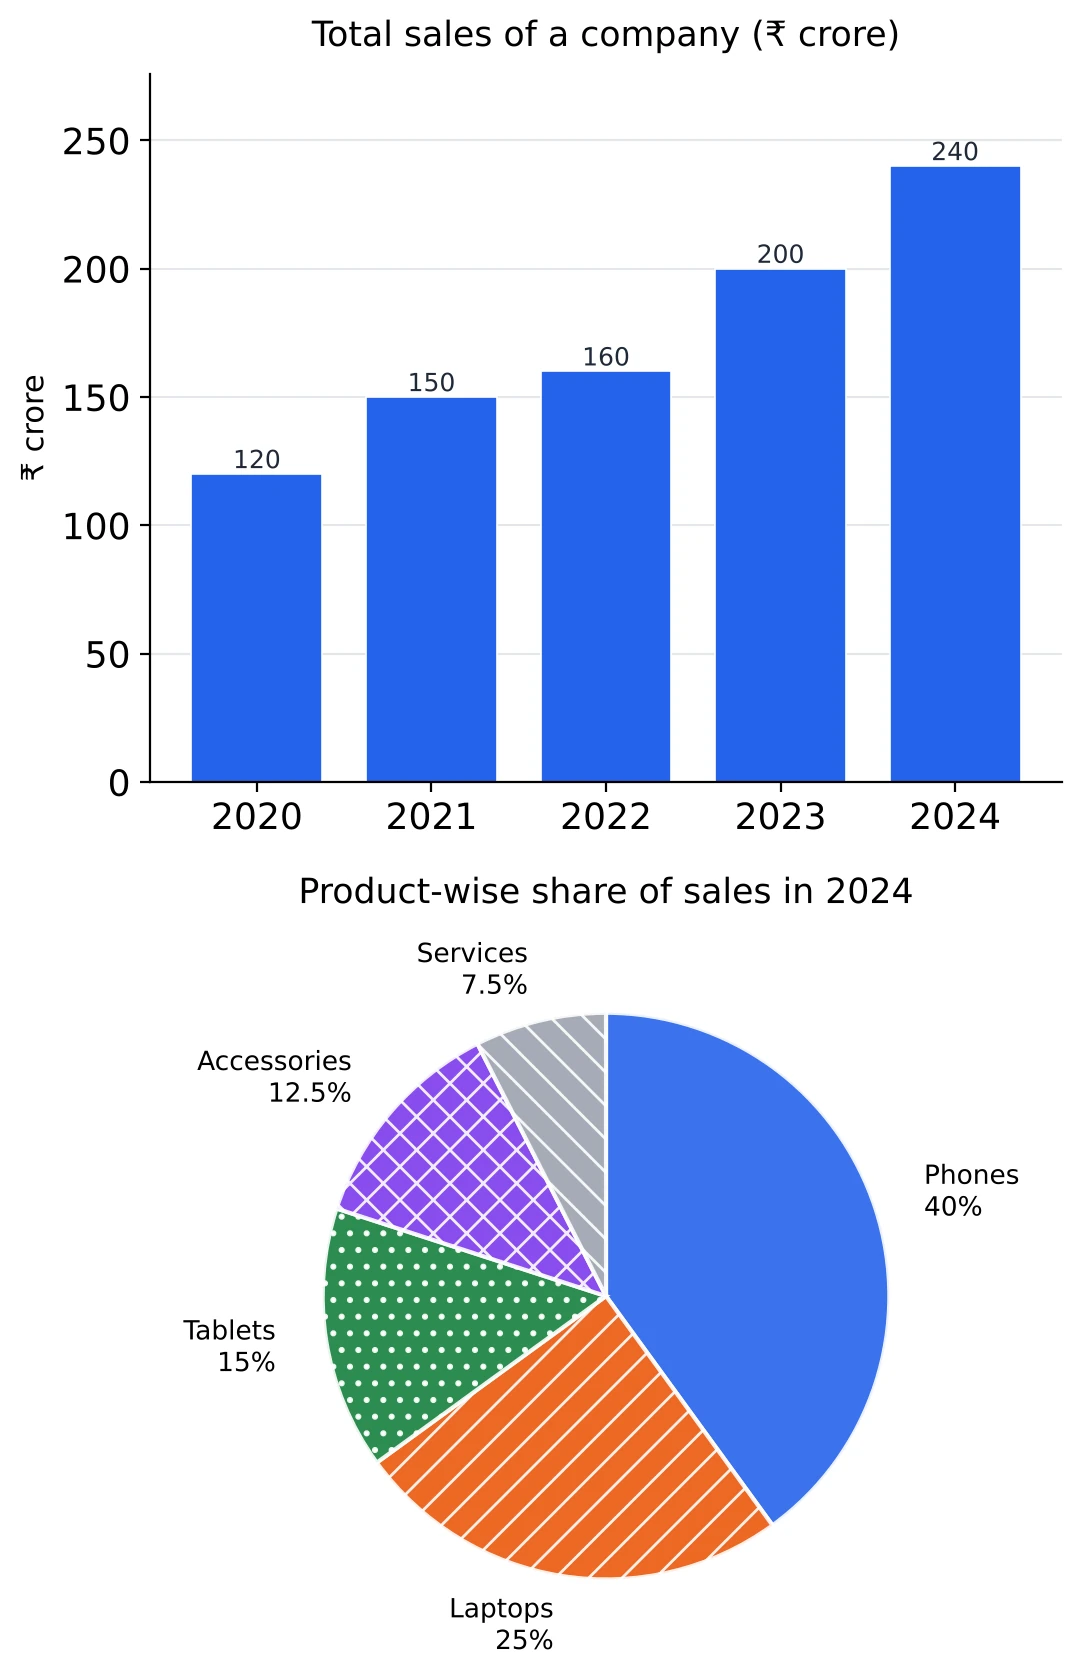
What were the company's sales of laptops in 2024? (a) ₹ 50 crore (b) ₹ 96 crore (c) ₹ 40 crore (d) ₹ 60 crore
Answer. The pie chart is for 2024, so I use the 2024 bar, ₹ 240 crore. Laptops have 25%, a quarter, and . So the answer is (d) ₹ 60 crore.
Question 19
Phones made up 45% of the company's sales in 2022. By what percentage did the sales of phones rise from 2022 to 2024? (a) 50% (b) (c) 25% (d)
Answer. Phones in 2022: 45% of 160 = ₹ 72 crore. Phones in 2024: 40% of 240 = ₹ 96 crore. The rise is 24 on 72, and . So the answer is (b) . Option (c), 25%, puts the same rise over 96, the 2024 value; a percentage change always goes over the old value.
Question 20
The company's 2024 sales of services were what percent of its total sales in 2020? (a) 7.5% (b) 12% (c) 15% (d) 18%
Answer. Services in 2024: 7.5% of 240 = ₹ 18 crore. Total sales in 2020: ₹ 120 crore. So , which is (c) 15%.
Question 21
The pie chart shows how a student spends a day of 24 hours. The figures are central angles.
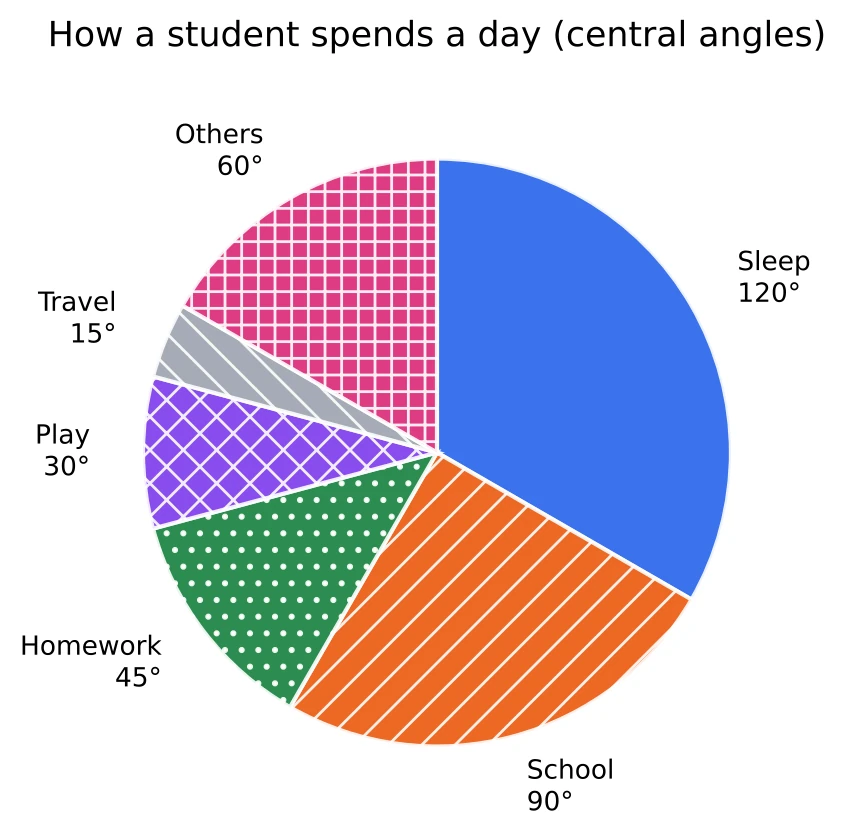
How many hours a day does the student spend on homework? (a) 4.5 hours (b) 2 hours (c) 3 hours (d) 6 hours
Answer. The whole circle is 24 hours, so 1 hour is . Homework has 45°, which is hours. So the answer is (c) 3 hours.
Question 22
What percentage of the day goes into school and homework together? (a) 37.5% (b) 25% (c) 45% (d)
Answer. School and homework together take . As a percentage that is . So the answer is (a) 37.5%. As a check, the two take hours, and 9 out of 24 is , which is also 37.5%.