
Graphs Are Not Decoration - They Are the Question
About half the exercise questions for this chapter are graph questions. Boards love them because a graph tests understanding rather than plugging into a formula, and JEE and NEET love them because a well-drawn graph question can be answered in twenty seconds by a student who sees it and not at all by one who doesn't.
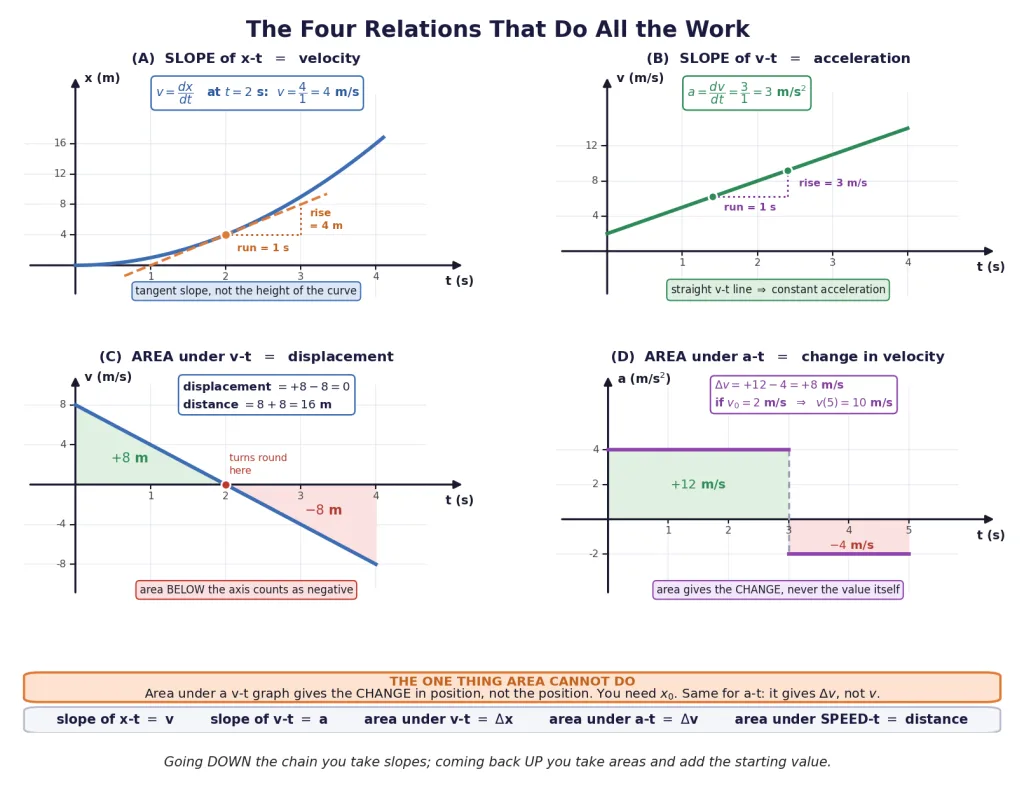
Here is the thing: you already know almost everything you need. Section 2 taught you that the tangent slope of an x-t graph is the velocity. Section 3 taught you that the slope of a v-t graph is the acceleration. Section 4 used the area under a v-t graph to derive the equations of motion. This section gathers those scattered facts into one toolkit, adds the two missing pieces, and then drills the skill until reading a graph feels like reading a sentence.
The master table - memorise this and nothing else
Key Point (the whole section in one table):
Graph Its SLOPE gives you Its AREA (with the time axis) gives you position-time (x-t) velocity, nothing physically useful velocity-time (v-t) acceleration, displacement, acceleration-time (a-t) (rate of change of - not in your syllabus) change in velocity, speed-time magnitude of acceleration distance travelled
Four rows, and between them they answer every graph question in the chapter.
Why an "area" can be a distance
Students find "area equals displacement" strange because area sounds like square metres. It isn't. On a graph, the area of a strip is (height) (width), so it carries the product of the two axis units:
- v-t graph: (m/s) (s) m. An area on a v-t graph is a length. That is displacement.
- a-t graph: (m/s^2) (s) m/s. An area on an a-t graph is a velocity. That is .
Whenever you are unsure what a graph's area means, multiply the axis units. The units tell you the answer.
Areas below the axis count as negative
This is where marks are lost. The v-t graph in panel (C) of the figure has velocity , so the object moves along until s and along after that.
- Area above the axis (0 to 2 s): m
- Area below the axis (2 to 4 s): m of area, but it counts as m
The object ends exactly where it started, having travelled 16 m. Both answers come from the same picture; the only difference is whether you attach the minus sign.
Speed-time versus velocity-time - a distinction that gets tested
Key Point: The area under a velocity-time graph is the displacement (signed). The area under a speed-time graph is the distance (always positive, since a speed-time graph never goes below the axis).
A speed-time graph is just the velocity-time graph with everything below the axis reflected upward. Questions often ask specifically for a speed-time plot of a bouncing ball, or hand you a speed-time graph to read. Read the axis label before you start; students routinely answer a speed-time question with a velocity-time argument and lose the mark.
The one thing an area cannot do
Key Point: The area under a v-t graph gives the change in position, never the position itself. To get you must be told , the position at the start.
A v-t graph is completely blind to where the object is. A car doing a steady 20 m/s in Delhi and an identical car doing 20 m/s in Chennai have exactly the same v-t graph. In calculus language, when you integrate you always pick up a constant of integration, and physically that constant is the initial position:
The same warning applies one level down: the area under an a-t graph gives , so you need to find the actual velocity. [JEE Tip] If a question gives you a v-t or a-t graph and asks for a position, the initial position must be stated somewhere in the problem. If it truly isn't, the only answerable question is displacement.
Down the Chain by Slopes, Up the Chain by Areas
The three graphs describe one single motion, so you can always move between them. There are exactly two directions and one tool for each.
Key Point: Going down the chain you differentiate, and you lose information (any constant disappears). Coming back up you integrate, and you must put that information back by hand as and .
What happens to the shape
Differentiating drops the degree of the curve by one. That gives you a fast sanity check on any sketch you produce:
| If the x-t graph is… | then the v-t graph is… | and the a-t graph is… |
|---|---|---|
| horizontal (constant) | zero (on the axis) | zero |
| a straight slope | horizontal, non-zero | zero |
| a parabola | a straight slope | horizontal, non-zero |
| a curve of changing curvature | a curve | a sloping line or curve |
Read it right to left as well: if the a-t graph is a horizontal line, the v-t graph must be a straight slope, and the x-t graph must be a parabola. That single chain catches most wrong options in a multiple-choice graph question before you calculate anything.
One motion, all three graphs
Let's do a full multi-stage conversion. A car starts from rest at the origin and moves along a straight road in four phases:
| Phase | Time | What it does | (m/s^2) |
|---|---|---|---|
| 1 | 0 to 4 s | speeds up from rest | |
| 2 | 4 to 10 s | cruises | |
| 3 | 10 to 14 s | brakes hard, passes through rest, reverses | |
| 4 | 14 to 16 s | brakes the reverse motion to a stop |
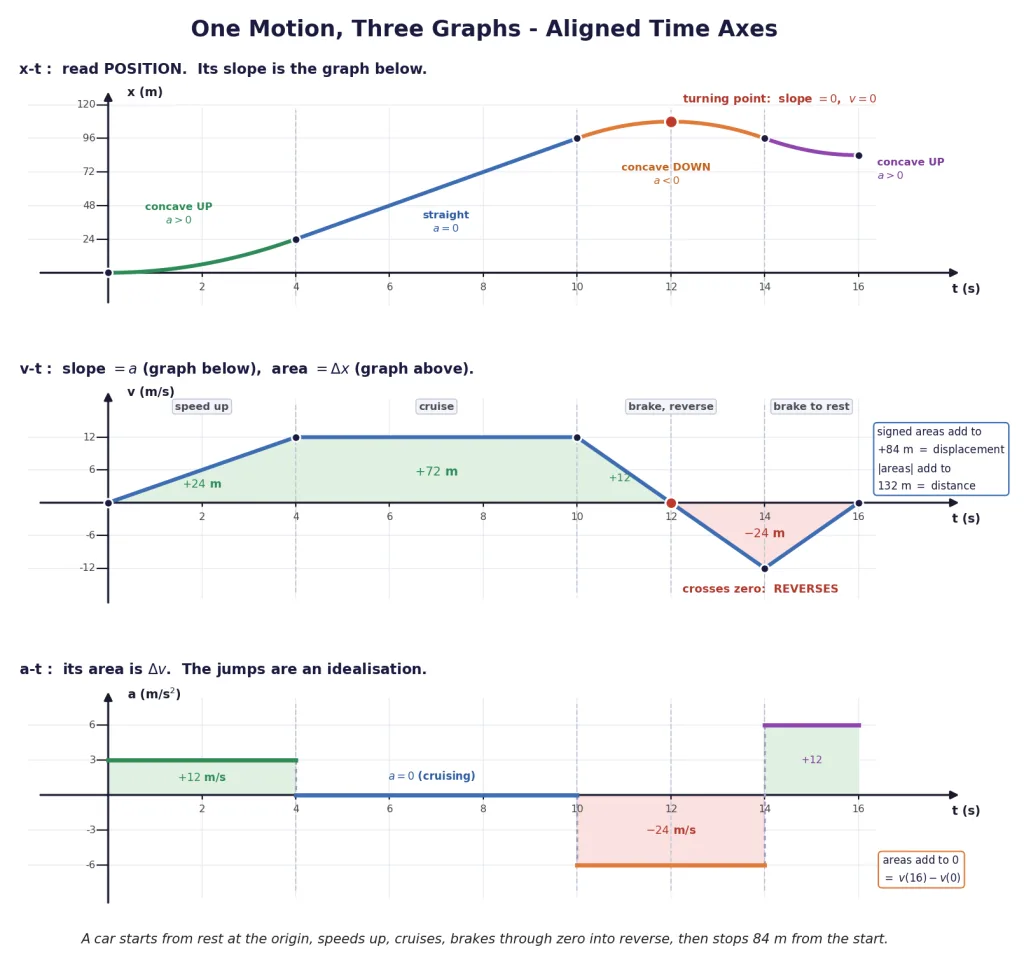
Step 1 - build the v-t graph from the a-t graph (areas). Start at and add the area of each block:
- Phase 1: area , so goes m/s.
- Phase 2: area , so stays at 12 m/s.
- Phase 3: area , so goes m/s. It passes through zero halfway, at s.
- Phase 4: area , so goes .
Because is constant in each phase, every v-t segment is a straight line. Total area under the a-t graph over the whole 16 s is , which matches . That is your check.
Step 2 - build the x-t graph from the v-t graph (areas again). Start at and accumulate:
| Interval | Area under v-t | Running position |
|---|---|---|
| 0 to 4 s | m | m |
| 4 to 10 s | m | m |
| 10 to 12 s | m | m |
| 12 to 14 s | m | m |
| 14 to 16 s | m | m |
Two different answers come out of the same table:
So the average velocity is m/s while the average speed is m/s. [Board Important] They differ precisely because the car reversed.
Step 3 - check the x-t curve against the a-t graph. Where the x-t curve is concave up; where it is a straight line; where it is concave down. Look at the top panel: bowl-shaped, then straight, then dome-shaped, then bowl-shaped again. It matches the bottom panel block for block.
Where the constant of integration shows up
Suppose the same car had started at m instead of at the origin. Nothing in the v-t or a-t graphs would change by even a pixel. Every entry in the position table would simply go up by 20 m, and the whole x-t curve would slide 20 m up the page keeping its shape exactly. That is what "a constant of integration" looks like on a graph: a vertical shift that the lower graphs cannot see.
Reading Any Curve: The Nine Questions
Given a graph, almost every question an examiner can ask is one of these nine. Learn the answer to each and the topic is finished.
1. Is the ordinate positive, or is the slope positive? They are different questions.
This is the single most common confusion in the chapter, so slow down here. On an x-t graph:
- The height of the curve tells you where the object is - which side of the origin.
- The slope of the curve tells you which way it is going.
They are completely independent. A curve can sit far below the axis (, the object is on the negative side) while sloping steeply upward (, it is moving towards the origin and beyond). Nothing is contradictory about that.
| On an x-t graph | Ordinate () | Slope () |
|---|---|---|
| above axis, rising | : right of origin | : moving along |
| above axis, falling | : right of origin | : moving along |
| below axis, rising | : left of origin | : moving along |
| below axis, falling | : left of origin | : moving along |
2. What does a horizontal line mean?
It means the plotted quantity is not changing. What that implies depends on which graph you are looking at - and mixing these up is a guaranteed lost mark.
| Horizontal line on… | means | Physically |
|---|---|---|
| x-t | position constant, | the object is at rest |
| v-t | velocity constant, | uniform motion at that speed (at rest only if the line lies on the axis) |
| a-t | acceleration constant | uniformly accelerated motion (at constant velocity only if the line lies on the axis) |
Notice that a horizontal line on a v-t graph does not mean the object is at rest. It means it is cruising. That is exactly the trap NEET sets.
3. What does a straight sloping line mean?
| Sloping straight line on… | means |
|---|---|
| x-t | constant velocity - uniform motion. The steeper the line, the faster |
| v-t | constant acceleration - uniformly accelerated motion |
| a-t | acceleration changing at a steady rate; this is not uniform acceleration, so the kinematic equations of Section 4 do not apply |
4. Where is the object momentarily at rest?
Wherever . On an x-t graph that is a point where the tangent is horizontal - a peak, a valley or a flat shoulder. On a v-t graph it is wherever the curve touches or crosses the time axis.
5. Where does the object reverse direction?
At a point where changes sign. On a v-t graph this means the curve crosses the axis - touching it and coming back the same side is not a reversal. On an x-t graph a reversal is a genuine turning point: the curve stops rising and starts falling (or the reverse).
Key Point: alone is not a reversal. A car that stops at a red light has for thirty seconds and then drives on in the same direction. A reversal needs to change sign.
6. Where is it speeding up and where is it slowing down?
Section 3 settled this and we will not re-derive it: compare the signs of and . Same sign means speeding up; opposite signs mean slowing down. On a graph:
- On a v-t graph: the curve moving away from the time axis (in either direction) means speeding up; moving towards the axis means slowing down. That is the fastest visual test there is.
- On an x-t graph: the tangent getting steeper (in either direction) means speeding up.
7. Where is the graph steepest?
The steepest point of an x-t graph is where the speed is greatest. The steepest point of a v-t graph is where the magnitude of acceleration is greatest. "Steepest" always means largest magnitude of slope, so a very steep downward segment counts - do not let the minus sign fool you into calling it small.
8. Which way does the x-t curve bend? (Concavity)
Key Point: On a position-time graph, concave up (holds water, bowl-shaped) means , and concave down (dome-shaped) means . A straight segment means .
The reason is short: concave up means the slope is increasing as you move right, and the slope is the velocity, so the velocity is increasing, so .
Two traps worth naming:
- Concavity has nothing to do with whether the curve is above or below the axis. A dome-shaped arc drawn entirely below the time axis still has .
- A point where the curve switches from concave down to concave up is an inflection point, and there for an instant. The object is not doing anything special at that moment - it is still moving - but the acceleration is changing sign there.
9. What if the time axis is negative?
Some graphs are plotted from s. Negative time simply means "before the instant we chose to call ", exactly as negative position means "on the other side of the origin". All nine rules above apply unchanged for .
[JEE/NEET] Run this checklist on any unfamiliar graph before you calculate: what are the axes? where is it zero? where does it cross? where is it flat? where is it steepest? which way does it bend? Six seconds of that beats two minutes of algebra.
Graphs That Cannot Exist
A standard question shows four graphs and asks which of them cannot possibly represent one-dimensional motion. It looks like a trick question. It isn't - there are only four ways a graph can be physically impossible, and every exam version of this question uses one of them.
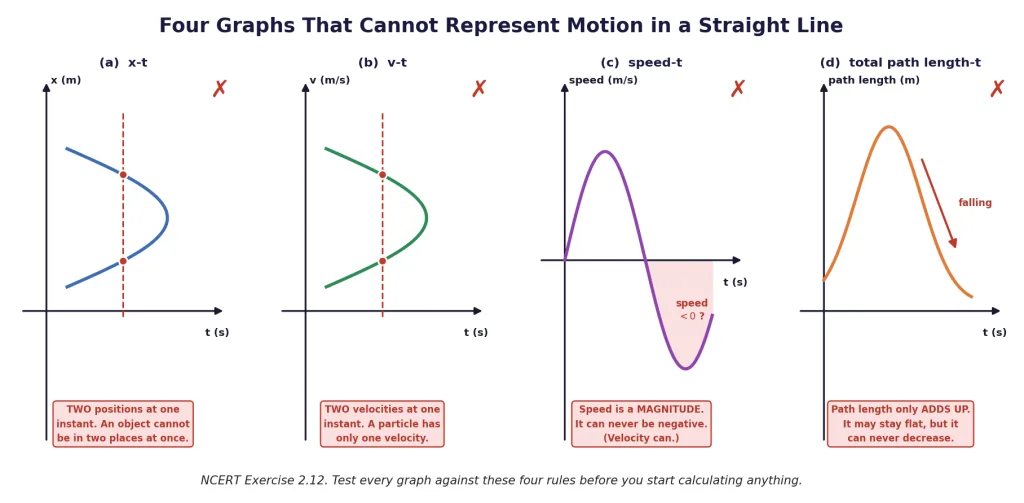
Rule 1: an x-t graph can never be double-valued
At one instant of time the particle is at exactly one place. If a vertical line drawn anywhere on the graph cuts the curve twice, the graph is claiming the particle is in two places at the same instant. Impossible.
This is just the function test from your maths class: must be a genuine function of .
Rule 2: an x-t graph can never be vertical
A vertical segment means a finite change in position in zero time, which is an infinite velocity. No object does that. A very steep line is fine and just means "very fast"; a truly vertical one is not.
Key Point: An x-t graph must pass the vertical-line test, and it must never be vertical itself. Both failures come from the same physical fact: a particle has one position and one finite velocity at each instant.
Rule 3: a v-t graph can never be double-valued either
A particle has one velocity at a time, for exactly the same reason. Note the asymmetry, though: a v-t graph may be vertical in an idealised problem (that is the instantaneous velocity jump of a bouncing ball, coming up in the next block), whereas an x-t graph may not. A jump in velocity is a physical idealisation; a jump in position is not even that.
Rule 4: some quantities simply cannot go negative or decrease
- Speed is the magnitude of velocity, so a speed-time graph can never dip below the time axis. (A velocity-time graph can and often does.)
- Total path length only ever accumulates. A path-length-versus-time graph can rise, or stay flat while the object rests, but it can never come back down. You cannot un-travel a distance.
What IS allowed, so you don't over-reject
Students who learn this list sometimes start rejecting perfectly good graphs. These are all legal:
| Feature | Legal? | Why |
|---|---|---|
| x-t graph below the axis | Yes | the object is on the negative side of the origin |
| x-t graph with a sharp corner (kink) | Yes, as an idealisation | velocity changes abruptly - see the note below |
| v-t graph below the axis | Yes | it is moving along |
| v-t graph with a vertical jump | Yes, as an idealisation | a collision, treated as instantaneous |
| a-t graph that jumps between values | Yes, as an idealisation | e.g. the instant brakes are applied |
| a graph that goes back to or into | Yes | time before the chosen zero instant |
An honest footnote: real graphs have no sharp kinks
Almost every idealised graph in this chapter has corners in it - the four-phase car of the last block changes its acceleration instantly at s, s and s.
Key Point: In any realistic situation the graphs are smooth: velocity and acceleration cannot change abruptly at an instant, and every change is continuous. The sharp corners exist only because we idealise, to keep the arithmetic clean.
A real driver's foot takes perhaps a tenth of a second to move from accelerator to brake, so a real a-t graph would show a steep but finite ramp instead of a vertical jump, and a real v-t graph would have its corner rounded off. If you zoomed in far enough on any corner in this chapter, you would find a smooth curve. Section 3 makes the same point from the differentiability side; here it is your licence to accept a kinked graph without worrying.
Matching a Situation to a Graph, and a Graph to a Situation
One standard question hands you three graphs and asks you to invent a physical situation for each; another does the reverse. Both are testing one skill: translating between a story and a shape. Here is the two-way dictionary.
Situation to graph
| The situation | x-t looks like | v-t looks like |
|---|---|---|
| A book lying on a table | horizontal line at | a line on the time axis |
| A car on cruise control on a straight highway | straight sloping line | horizontal line above the axis |
| A car starting from rest and accelerating uniformly | parabola opening upward from | straight line rising from the origin |
| A car braking uniformly to a stop | curve rising and flattening out | straight line falling to the axis |
| A ball thrown straight up and caught again | a downward parabola (rise and fall) | a straight line of slope crossing the axis once |
| A stone dropped, hitting sand and stopping dead | parabola then a horizontal line | line of slope , then a jump to zero |
| A man walking to a shop, waiting, then walking home faster | up, flat, then steeply down to the start | positive block, zero block, then a bigger negative block |
Two of those deserve a closer look.
The ball thrown up. Take up as positive. The x-t graph is a single downward parabola: it rises, flattens at the top and comes back down. The v-t graph is one straight line of constant slope that starts positive, crosses the time axis exactly at the top of the flight, and continues negative. [NEET Important] The v-t graph does not have a corner at the top. Nothing happens to the acceleration there; only the velocity passes through zero.
The walk to the shop. The steeper the return segment, the faster the return journey. Because the return slope is negative and larger in magnitude, the graph is asymmetric - and the fact that the man ends at his starting position means the graph returns to its starting height, giving zero displacement for the day.
Graph to situation
Now the harder direction. The trick is to describe the graph out loud in kinematic language first, then invent a story that fits.
Graph A: an x-t graph that stays at zero, then rises steeply and abruptly returns to zero, repeatedly. Read it out: the object sits at the origin, jumps away and comes straight back, over and over. Situation: a ball being bounced against a wall and returning, or a player repeatedly running to a mark and back to base.
Graph B: a v-t graph that is zero for a while, then a sharp positive spike that decays, then a smaller negative spike, then a smaller positive one, dying away. Read it out: at rest, given a sudden push, then reversed with a smaller speed, then reversed again. Situation: a ball kicked along a floor between two walls, rebounding off each with reduced speed until it stops.
Graph C: an a-t graph that is zero except for two short, sharp pulses of opposite sign. Read it out: no acceleration except at two brief instants. Situation: a ball hit by a bat, and later caught - the only accelerations are the two impacts.
Graph D: an x-t graph that is a horizontal line along for and a rising parabola for . The tempting answer is "the particle moves in a straight line for and on a parabolic path for " - and it is wrong.
Key Point: An x-t graph is not a map of the path. The motion here is along a straight line for the entire time; only the graph is parabolic. A parabolic x-t graph means uniform acceleration, not a curved trajectory.
A suitable physical context: a ball lying at rest against a wall until , then given a push and released so that it accelerates uniformly away, or a body at rest that is dropped at (with measured downward).
The three questions that always work
Faced with any unfamiliar graph in an exam:
- What are the axes? Position, velocity, speed or acceleration - the whole answer hinges on this.
- What is the object doing at ? At rest? Moving? At the origin or somewhere else?
- What changes, and at which instants? Every corner, crossing and flat stretch is one event in the story.
[Board Important] In a Board answer, always write the reason next to the choice: "B walks faster because the slope of B's x-t graph is greater in magnitude". The mark is for the reason, not the choice.
Two Motions Worth Knowing Cold: the Bouncing Ball and SHM
These two turn up in exercise sets, in Board papers and in NEET's graph-recognition questions almost every year. Learn their shapes once.
A ball bouncing on the floor
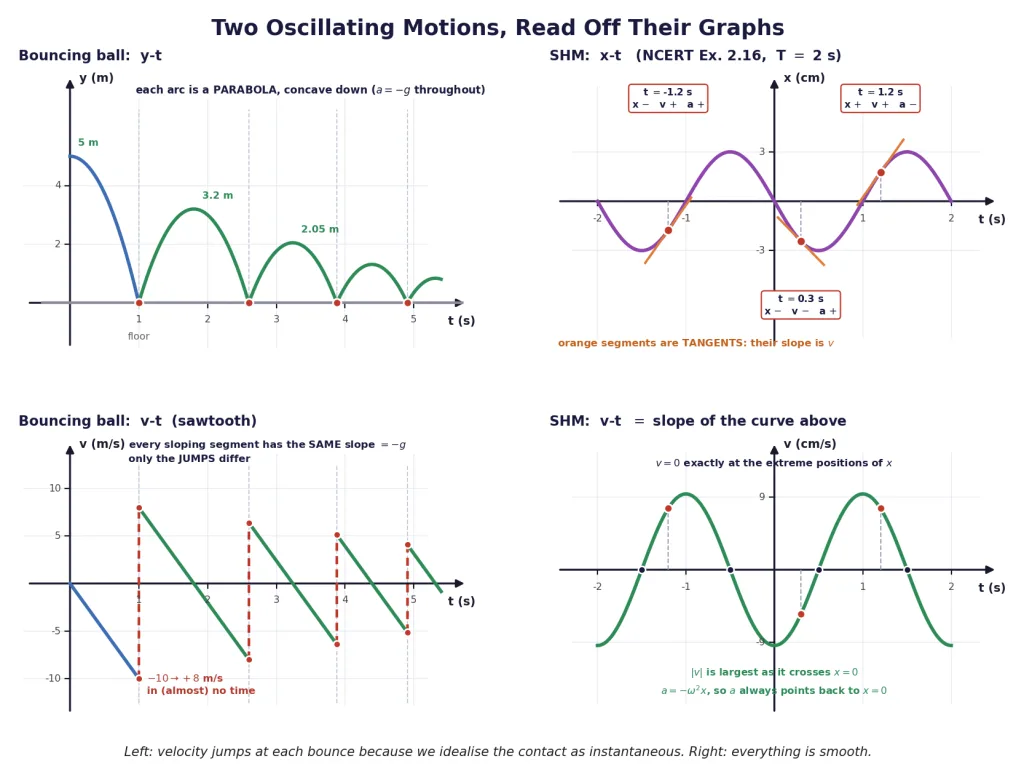
Take the floor as and upward as positive. Drop the ball from 5 m with m/s^2, and suppose each bounce returns it with 80% of its striking speed.
The y-t graph is a chain of parabolic arcs of decreasing height: 5 m, then 3.2 m, then 2.048 m, and so on. Every arc is concave down, because between bounces the only acceleration is and that never changes. The arcs get shorter and narrower, because a lower bounce takes less time. The curve touches at each bounce and comes back up in a sharp cusp.
The v-t graph is a sawtooth. Between bounces the velocity falls along a straight line of slope - and crucially, every one of those sloping segments has exactly the same slope, because is the same for every bounce. What changes from bounce to bounce is only the height of the jumps:
| Event | Velocity just before | Velocity just after |
|---|---|---|
| 1st bounce, s | m/s | m/s |
| 2nd bounce, s | m/s | m/s |
| 3rd bounce, s | m/s | m/s |
What the discontinuities mean
At each bounce the v-t graph shows a vertical jump from a negative value to a positive one. What is really happening?
Key Point: The jump represents the collision with the floor. During contact the floor pushes up with an enormous force, so the acceleration is enormous - hundreds of m/s^2 upward, briefly - and the velocity reverses. We draw it as instantaneous because the contact lasts only a few milliseconds compared with a flight time of about a second.
Three things follow, and all three get asked:
- The sign flip is the reversal. Downward motion becomes upward motion at that instant. The v-t curve crosses the axis vertically rather than sloping through it.
- The jump is not infinite in reality. A real contact takes a short but non-zero time, so a real v-t graph is a very steep line, not a vertical one - the smooth-graph rule from the last block.
- Speed drops at each impact. The rebound speed is smaller than the striking speed, so the graph's peaks shrink geometrically. Draw them shrinking, or you lose the mark.
[Board Important] If the question asks for a speed-time graph, reflect all the negative parts upward. You then get a series of straight lines rising to a peak at each impact and falling back to zero at each apex - a row of triangles of decreasing height, all with slope magnitude .
A particle in simple harmonic motion
A common question gives an x-t plot that is a sinusoid and asks for the signs of , and at three instants. You do not need any SHM theory from Chapter 13; you need this section's slope-and-curvature rules and nothing else.
Key Point (the drill):
- Sign of : is the curve above or below the time axis?
- Sign of : is the curve rising or falling there? (slope)
- Sign of : which way does it bend there? Concave up gives , concave down gives . Equivalently, for SHM, , so always has the opposite sign to - it always points back towards .
That last shortcut is worth gold: once you know the sign of , you know the sign of for free, and you only ever have to read the slope.
Around one full cycle of :
| Quarter | Curve is | Motion | |||
|---|---|---|---|---|---|
| 0 to | rising to the peak | slowing down | |||
| to | falling from the peak | speeding up | |||
| to | falling to the trough | slowing down | |||
| to | rising from the trough | speeding up |
And the two special sets of instants:
- At the extremes (, the peaks and troughs): the tangent is horizontal, so and the speed is zero, while is at its maximum.
- At the centre (, where the curve crosses the axis): the curve is steepest, so the speed is maximum, while .
Notice how the speed and acceleration are exactly out of step - each is largest where the other vanishes. That single sentence answers most SHM graph questions you will meet before Chapter 13.
Solved Examples
Example 1: Reading three intervals off a piecewise x-t graph
A particle's x-t graph consists of straight segments joining the points , , and . For each of the three 3-second intervals give the velocity, and then find the average velocity and average speed for the whole 9 s.
Solution:
- Velocity is the slope of each straight segment.
- Interpret the signs. In interval 1 the particle moves along ; in interval 2 it is at rest (horizontal segment); in interval 3 it moves along , and it is faster than in interval 1 because .
- Displacement over 9 s is the net change in the ordinate: m.
- Distance is the total path length. Add the magnitudes segment by segment: m.
- Averages:
Final Answer: m/s, , m/s; average velocity m/s, average speed m/s.
Takeaway: The interval with the greatest average speed is the one where the graph is steepest, regardless of the sign. Interval 3 wins even though its velocity is the most negative number.
Example 2: Two children walking home
The x-t graphs of two children A and B returning from school O to their homes P and Q are straight lines. A's line starts at the origin and ends at ; B's line starts later, at with , and ends at the same time at the greater height . Answer: (a) who lives closer to school, (b) who starts earlier, (c) who walks faster, (d) do they reach home at the same time, (e) does either overtake the other on the road?
Solution:
- (a) Who lives closer. The final height of each line is the distance of that home from school. A's line ends at and B's at the higher value , so : A lives closer.
- (b) Who starts earlier. A's line leaves the time axis at ; B's leaves it later. A starts earlier.
- (c) Who walks faster. Speed is the magnitude of the slope. B covers a greater distance in a shorter time, so B's line is steeper: B walks faster.
- (d) Do they arrive together? Both lines end at the same instant , so yes, they reach home at the same time.
- (e) Overtaking. An overtake is a point where the two lines cross. B starts behind A (later, from the same origin) and ends ahead, so the lines must cross exactly once. B overtakes A, once.
Final Answer: (a) A, (b) A, (c) B, (d) same time, (e) B overtakes A once.
Takeaway: On a two-object x-t graph, a crossing means they are at the same place at the same time - a meeting or an overtake. Never read "the graphs get close" as an overtake; only an actual intersection counts. Reading the crossing off the picture is this section's job; computing when two objects meet from their speeds is relative velocity, and that is Section 6.
Example 3: Plotting a real journey
A woman leaves home at 9.00 am, walks at 5 km/h along a straight road to her office 2.5 km away, stays there until 5.00 pm and returns home by auto at 25 km/h. Choose scales and describe the x-t graph completely.
Solution:
- Set up the frame. Take home as , the office direction as , and at 9.00 am. Then runs from 0 to 2.5 km and from 0 to just over 8 h. Suitable scales: 1 cm h on the time axis, 1 cm km on the position axis.
- Segment 1 - the walk. So she reaches the office at 9.30 am. This is a straight line from to , of slope km/h.
- Segment 2 - at the office. From 9.30 am to 5.00 pm she does not move, so the graph is a horizontal line at km. Slope zero, velocity zero, lasting 7.5 h.
- Segment 3 - the auto ride. She is home at 5.06 pm. A straight line from down to , of slope km/h - five times as steep as the walk, and pointing downward.
- Whole-journey figures. Displacement over the day is zero (she ends where she began), so the average velocity is zero. The distance is 5.0 km in 8.1 h, so the average speed is km/h.
Final Answer: Rising line 9.00 to 9.30 am (slope km/h), flat line to 5.00 pm, steep falling line to 5.06 pm (slope km/h); average velocity zero, average speed 0.62 km/h.
Takeaway: The ratio of the two slopes is the ratio of the speeds - the return line must be exactly five times steeper than the outward line. Examiners check that visually, so draw it.
Example 4: Displacement and distance from a v-t graph
The v-t graph of a particle is made of straight segments through , , and . Find (a) the acceleration in each phase, (b) the instant the particle reverses, (c) the displacement and (d) the distance travelled in the 13 s.
Solution:
- (a) Accelerations are the slopes.
- (b) The reversal is where the last segment crosses the time axis. It falls from to m/s over 3 s at 10 m/s per second, so it reaches zero after s, i.e. at s.
- (c) Displacement is the signed area. Split it into pieces:
- 0 to 5 s (triangle): m
- 5 to 10 s (rectangle): m
- 10 to 11.5 s (triangle above axis): m
- 11.5 to 13 s (triangle below axis): m of area, counted as m
- (d) Distance adds the magnitudes instead:
Final Answer: , , m/s^2; reverses at s; displacement 112.5 m; distance 135 m.
Takeaway: The moment a v-t graph crosses the axis, stop and split the area there. Computing the last trapezium in one go gives you the displacement but silently destroys the distance.
Example 5: Climbing the chain - a-t to v-t to x-t
A particle moves along a straight line with m/s^2 from to s, and m/s^2 from s to s. At it is at m moving with m/s. Find and at s and at s, and say whether the particle ever reverses.
Solution:
- Velocity from the area under the a-t graph. Area of the first rectangle is m/s, so Area of the second rectangle is m/s, so
- Does it reverse? The velocity starts at , rises to , then falls back to - it is positive throughout and never touches zero. No reversal. So over this interval distance and displacement are equal.
- Position from the area under the v-t graph. From 0 to 3 s the v-t graph is a trapezium with parallel sides 1 and 7 and width 3:
- From 3 to 9 s it is a trapezium with parallel sides 7 and 1 and width 6:
- Cross-check with the kinematic equations. For phase 1, m. It matches.
Final Answer: m/s, m/s, m, m; the particle never reverses.
Takeaway: The trapezium rule handles any straight-line v-t segment in one step - and it is exactly in disguise.
Example 6: Going down the chain from a parabola
A ball is thrown vertically upward and its height follows (metres, seconds), with up as positive. Sketch and describe the v-t and a-t graphs, and mark the turning point on the x-t graph.
Solution:
- Differentiate once for velocity. That is a straight line starting at m/s and falling with slope . It crosses the time axis at s.
- Differentiate again for acceleration. A horizontal line at , below the time axis, unchanging for the whole flight - including at the top.
- The turning point. The x-t graph has zero slope where , i.e. at s, and the height there is The x-t graph is a downward parabola with its peak at , concave down everywhere - consistent with everywhere.
- Check with areas, going back up the chain. Area under the v-t line from 0 to 2 s is m, which is the rise. From 2 to 4 s the line runs from 0 to m/s, giving m: the ball comes back down to at s. So over the whole flight the displacement is 0 while the distance is 40 m.
Final Answer: (falling straight line crossing zero at s); m/s^2 (horizontal line); peak at ; total distance 40 m, displacement 0.
Takeaway: The v-t graph has no kink at the top of the flight. Students routinely draw a "V" there because the ball changes direction, but the acceleration never changes, so the line never bends. Only the x-t graph turns around.
Example 7: Which graphs are impossible?
State with reasons which of the following cannot represent one-dimensional motion of a particle: (a) an x-t graph shaped like a sideways parabola, so that a vertical line at some instant cuts it twice; (b) a v-t graph of the same sideways shape; (c) a speed-time graph that dips below the time axis; (d) a graph of total path length against time that rises, peaks and then falls.
Solution:
- (a) Impossible. A vertical line cuts the curve twice, so the graph claims the particle occupies two positions at the same instant. A particle has exactly one position at each time.
- (b) Impossible. Same reasoning one level up: the graph gives the particle two velocities at the same instant. A particle has one velocity at a time.
- (c) Impossible. Speed is , a magnitude, and a magnitude can never be negative. (Had the axis been labelled velocity, this graph would be perfectly fine and would simply describe a reversal.)
- (d) Impossible. Total path length is a running total of distance covered. It can increase, or stay constant while the particle rests, but it can never decrease - you cannot un-travel a distance.
Final Answer: All four are impossible, for the four distinct reasons above.
Takeaway: Note how much rides on the axis label. The identical curve is legal as a velocity-time graph and illegal as a speed-time graph. Read the label before the shape.
Example 8: Reading signs off an SHM curve
The x-t plot of a particle in one-dimensional SHM has period s. At the curve is at and heading downward; it reaches its most negative value at s and its most positive at s. Give the signs of position, velocity and acceleration at s, s and s.
Solution:
- Fix the shape. These conditions describe , since rad/s. But you can answer entirely by reading the picture.
- At s. This lies in the first half-second, where the curve has left zero going downward and has not yet reached the trough at s. So the curve is below the axis and still falling.
- is negative; (slope) is negative; and since with , is positive.
- At s. The trough is at 0.5 s and the crest at 1.5 s, so at 1.2 s the curve has already crossed back above the axis (at s) and is climbing towards the crest.
- is positive; is positive; is negative.
- At s. The pattern repeats with period 2 s, so s behaves like s. At 0.8 s the curve is past the trough (0.5 s) and rising back towards zero (at 1.0 s), still below the axis.
- is negative; is positive; is positive.
Final Answer:
| Instant | |||
|---|---|---|---|
| s | |||
| s | |||
| s |
Takeaway: Get the sign of from the picture, then the sign of is automatically opposite because . That leaves only one thing to read off the graph: whether it is rising or falling. Three quantities, one reading.
Example 9: The speed-time graph of a bouncing ball
A ball is dropped from a height of 90 m onto a floor. At each collision it loses one tenth of its speed. Take m/s^2 and plot the speed-time graph from to s. Give the key coordinates.
Solution:
- The first fall. Using with : and the time to fall, from : So the graph is a straight line from up to , of slope .
- The first collision. The ball loses one tenth of its speed, so it leaves the floor at The graph drops vertically from 42 to 37.8 m/s at s.
- The upward flight. Speed falls from 37.8 m/s to zero at the top, at a rate of 9.8 m/s per second: so the ball is at its apex at s, where the speed graph touches zero.
- The fall back down. By symmetry it takes another 3.86 s to return to the floor, arriving at with speed 37.8 m/s again. That is exactly where the question stops - which is why the plot window ends at 12 s.
- The plot. A straight line from to ; a vertical drop to 37.8; a straight line down to ; a straight line back up to . Every sloping segment has slope magnitude 9.8, since is the same throughout.
Final Answer: Rising line to , vertical drop to 37.8 m/s, falling line to , rising line to .
Takeaway: On a speed-time graph the ball's motion looks like a set of triangles, because the downward journeys have been flipped above the axis. On a velocity-time graph the same motion is a sawtooth crossing the axis. Same physics, two pictures - draw whichever the question names.
Example 10: Sign regions of a cubic x-t graph
A particle moves with (metres, seconds). Find the instants at which it is momentarily at rest, the instant at which the x-t graph changes its concavity, and the intervals in which it is speeding up or slowing down between and s. Also find its distance and displacement over that interval.
Solution:
Velocity and acceleration.
Momentarily at rest where : at s and s. Both are genuine turning points of the x-t graph, since changes sign at each.
Concavity changes where , i.e. s. Before that (concave down); after it (concave up). s is the inflection point. The particle is not at rest there - it is moving at m/s, its fastest in the backward direction.
Speeding up or slowing down - compare the signs of and :
Interval sign of sign of Verdict 0 to 1 s slowing down 1 to 2 s speeding up 2 to 3 s slowing down 3 to 4 s speeding up Positions at the key instants: , m, , m.
Displacement m. Distance adds the legs: m.
Final Answer: At rest at s and s; inflection at s; slowing / speeding / slowing / speeding in the four intervals; displacement 4 m, distance 12 m.
Takeaway: Notice that the particle is speeding up while the acceleration is negative (1 to 2 s) and slowing down while it is positive (2 to 3 s). The sign of on its own tells you nothing - only its sign relative to does.
Example 11: Reading a speed-time graph in three intervals
A speed-time graph for a particle moving in a constant direction consists of straight segments through , , and . Three equal 2-second intervals are marked. In which interval is the magnitude of the average acceleration greatest, and in which is the average speed greatest? Give the signs of and in each interval, and the total distance.
Solution:
- Average acceleration in each interval is the slope of that segment. The greatest magnitude is 6 m/s^2, in interval 3. Note that it is the most negative number that wins - magnitude, not value.
- Average speed in each interval is (area under that segment) / (2 s).
- Interval 1, triangle: m, so average speed m/s.
- Interval 2, trapezium: m, so average speed m/s.
- Interval 3, triangle: m, so average speed m/s. The greatest is interval 2, at 10 m/s.
- Signs. The particle moves in one constant direction, taken as positive, so throughout all three intervals. For the acceleration: in intervals 1 and 2 (speed rising), in interval 3 (speed falling).
- Total distance is the whole area: m.
Final Answer: Greatest average acceleration magnitude in interval 3 (6 m/s^2); greatest average speed in interval 2 (10 m/s); in all three, ; total distance 40 m.
Takeaway: Two different questions, two different graph features. "Greatest average acceleration" is about slope; "greatest average speed" is about area. Students who answer both with the steepest segment lose half the marks.
Example 12: Matching situations to graph shapes
For each situation, state the shape of the x-t graph and of the v-t graph. Take the direction of initial motion as positive throughout. (a) A parachutist falls, then opens the parachute and descends at a steady rate. (b) A cricket ball is thrown along the ground, decelerates uniformly and stops. (c) A lift starts from rest, rises, and stops at a higher floor.
Solution:
- (a) Parachutist. Before the parachute opens the speed increases, so the v-t graph rises from zero; after it opens the speed settles at a constant terminal value, so the v-t graph becomes horizontal. The x-t graph (distance fallen against time) is therefore concave up at first (accelerating), then becomes a straight sloping line (constant velocity). The transition is a bend, not a jump.
- (b) Ball on the ground. Uniform deceleration means constant negative acceleration, so the v-t graph is a straight line falling from to zero, then staying at zero. The x-t graph rises and flattens out, concave down while it is slowing, then horizontal once it has stopped. It never comes back down: the ball stops, it does not return.
- (c) Lift. Three phases: speeding up, moving steadily, slowing to rest. The v-t graph is a trapezium - a rising line, a horizontal top, then a falling line back to zero. The x-t graph is therefore concave up, then straight, then concave down, ending on a horizontal line at the new floor.
Final Answer: (a) concave up then straight / rising then horizontal; (b) concave down then horizontal / straight line falling to zero; (c) concave up, straight, concave down / a trapezium.
Takeaway: Build every sketch from the v-t graph first - it is easier to reason about "is it speeding up, steady, or slowing?" than about curvature. Then convert: rising v-t means concave-up x-t, flat v-t means straight x-t, falling v-t means concave-down x-t.