
What an ECG Is, and How It Is Taken
An ECG is a graphical representation of the electrical activity of the heart during a cardiac cycle. The machine that produces it is the electro-cardiograph, and the trace it draws is the electrocardiogram (ECG) - the line you have seen crawling across a hospital monitor.
How a standard ECG is recorded:
- The patient is connected to the machine with THREE electrical leads - one to each wrist and one to the left ankle - and these continuously monitor the heart activity.
- For a detailed evaluation of the heart's function, multiple leads are attached to the chest region.
Three leads, and their three addresses, are the examinable part: left wrist, right wrist and left ankle. Notice the asymmetry - both wrists but only the LEFT ankle.
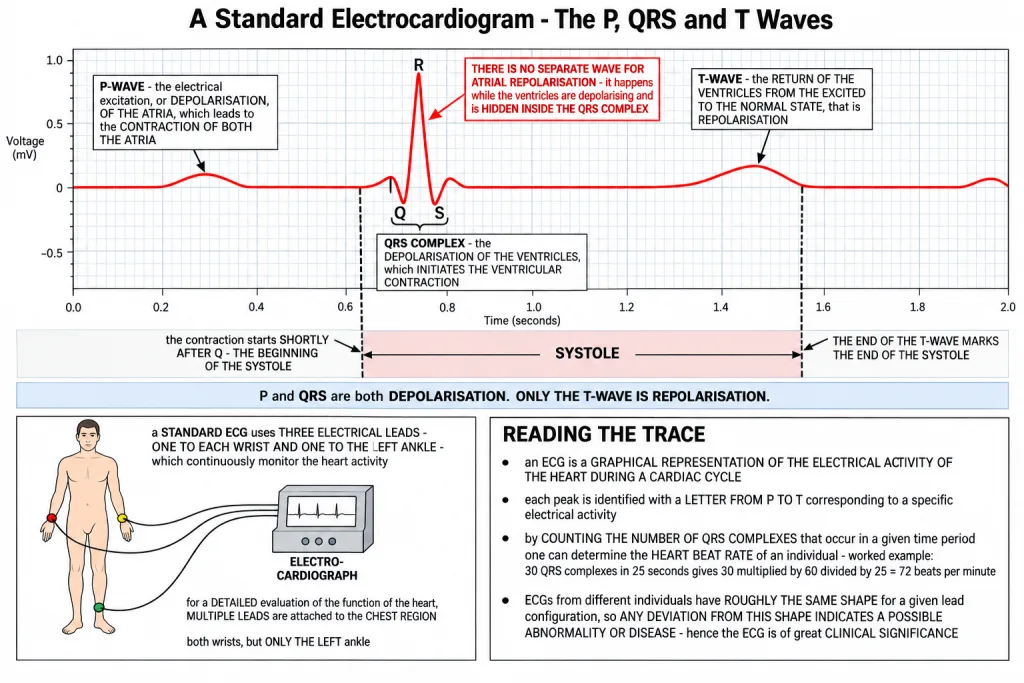
Every bump on the trace has a name. Each peak in the ECG is identified with a letter from P to T that corresponds to a specific electrical activity of the heart. So the trace is read left to right as P, then the QRS complex, then T, once for every cardiac cycle.
[NEET Important] Two facts are lifted straight out of this paragraph: THREE leads for a standard ECG - one to each wrist and one to the LEFT ANKLE - and letters from P to T. The usual wrong options give twelve leads (that is the detailed chest recording, not the standard one) or put a lead on both ankles.
The Three Waves and What Each One Means
Each wave is one electrical event in the heart, and the chapter gives each of them a single precise meaning. Learn the table as it stands, because the wording is the answer.
| Wave | What it represents | What it marks |
|---|---|---|
| P-wave | the electrical excitation, or DEPOLARISATION, of the ATRIA | it leads to the contraction of both the atria |
| QRS complex | the DEPOLARISATION OF THE VENTRICLES | it initiates the ventricular contraction; the contraction starts shortly after Q and marks the BEGINNING of the systole |
| T-wave | the return of the ventricles from the excited to the normal state - REPOLARISATION | the END of the T-wave marks the END of the systole |
So the systole is bracketed by the trace. It begins shortly after Q and it ends at the end of the T-wave - two landmarks worth quoting exactly, because a question often gives you one and asks for the other.
And note which are depolarisations. P and QRS are both DEPOLARISATION - excitation leading to contraction. Only the T-wave is REPOLARISATION - the recovery of the ventricles.
[NEET Important] The swapped pair here is P and T. P is the DEPOLARISATION of the ATRIA; T is the REPOLARISATION of the VENTRICLES - different chambers and opposite electrical events, so an option that says "P-wave, repolarisation of the atria" is wrong twice over. There is NO separate wave for atrial repolarisation on a standard ECG - it happens while the ventricles are depolarising and is hidden inside the QRS complex, so a question asking which electrical event has no wave of its own is answered with atrial repolarisation.
Reading the Trace - Rate and Clinical Use
The pattern repeats once for every cardiac cycle, and that is what makes the trace countable.
- By counting the number of QRS complexes that occur in a given time period, one can determine the heart beat rate of an individual. One QRS complex is one ventricular contraction, so complexes counted over a known time convert straight into beats per minute.
- ECGs obtained from different individuals have roughly the same shape for a given lead configuration. That is the whole basis of the test - there is a normal to compare against.
- Therefore any deviation from this shape indicates a possible abnormality or disease. Hence the ECG is of great clinical significance.
Work an example. If a trace shows 30 QRS complexes in 25 seconds, then in 60 seconds there would be 30 multiplied by 60 divided by 25 = 72 complexes, so the heart rate is 72 beats per minute - the normal figure this chapter uses throughout.
[NEET Important] Heart rate is read from the QRS complexes, not from the P-waves and not from the T-waves. And keep the reasoning behind the clinical value in the right order: the shape is roughly the same in different individuals for a given lead configuration, SO a deviation from that shape indicates a possible abnormality or disease.
Quick Recap
- An ECG is a graphical representation of the electrical activity of the heart during a cardiac cycle, obtained with an electro-cardiograph.
- For a standard ECG the patient is connected with THREE electrical leads - one to each wrist and one to the left ankle - which continuously monitor heart activity.
- For a detailed evaluation of the heart's function, multiple leads are attached to the chest region.
- Each peak is identified with a letter from P to T corresponding to a specific electrical activity of the heart.
- P-wave: the electrical excitation, or depolarisation, of the atria, which leads to the contraction of both the atria.
- QRS complex: the depolarisation of the ventricles, which initiates the ventricular contraction; the contraction starts shortly after Q and marks the BEGINNING of the systole.
- T-wave: the return of the ventricles from the excited to the normal state, that is repolarisation; the END of the T-wave marks the END of the systole.
- There is no separate wave for atrial repolarisation - it is hidden within the QRS complex.
- Counting the QRS complexes in a given time period gives the heart beat rate of an individual.
- ECGs from different individuals have roughly the same shape for a given lead configuration, so any deviation from this shape indicates a possible abnormality or disease - hence the ECG is of great clinical significance.
Solved Examples
Question 1
Q. What is an ECG, and what is the machine that records it called?
Answer. An ECG, or electrocardiogram, is a graphical representation of the electrical activity of the heart during a cardiac cycle. The machine used to obtain it is the electro-cardiograph.
Question 2
Q. How is a patient connected to the machine to obtain a standard ECG?
Answer. With three electrical leads - one to each wrist and one to the left ankle - and these continuously monitor the heart activity.
Question 3
Q. What is done when a more detailed evaluation of the heart's function is needed?
Answer. Multiple leads are attached to the chest region. The three-lead recording is only the standard ECG.
Question 4
Q. How are the peaks of an ECG named?
Answer. Each peak is identified with a letter from P to T, and each letter corresponds to a specific electrical activity of the heart.
Question 5
Q. What does the P-wave represent, and what follows it?
Answer. The electrical excitation, or depolarisation, of the atria. It leads to the contraction of both the atria.
Question 6
Q. What does the QRS complex represent, and what does it mark?
Answer. The depolarisation of the ventricles, which initiates the ventricular contraction. The contraction starts shortly after Q, and that marks the beginning of the systole.
Question 7
Q. What does the T-wave represent, and what does its end mark?
Answer. The return of the ventricles from the excited state to the normal state, that is repolarisation. The end of the T-wave marks the end of the systole.
Question 8
Q. Write the differences between P-wave and T-wave. This is one of the chapter-end exercises.
Answer. They are the first and the last wave of one cardiac cycle, and they differ in the chamber, the electrical event and what each leads to.
| Feature | P-wave | T-wave |
|---|---|---|
| Which chambers | the ATRIA | the VENTRICLES |
| Electrical event | depolarisation - the electrical excitation of the atria | repolarisation - the return of the ventricles from the excited to the normal state |
| What follows or accompanies it | it leads to the contraction of both the atria | it accompanies the relaxation of the ventricles, as they recover electrically |
| Position in the trace | the FIRST wave of the cycle, before the QRS complex | the LAST wave of the cycle, after the QRS complex |
| Landmark in the cycle | it precedes the beginning of systole, which starts shortly after Q | its END marks the END of the systole |
| Shape on the trace | a small rounded upward wave | a broader rounded upward wave |
Question 9
Q. Draw a standard ECG and explain the different segments in it. This is one of the chapter-end exercises.
Answer. What the trace looks like, described so that you can draw it yourself on graph paper, reading from left to right:
- Start with a flat horizontal baseline.
- Then a small rounded UPWARD bump - the P wave.
- Then a short flat stretch back on the baseline.
- Then the tall narrow QRS complex, drawn as three strokes together: a small DOWNWARD deflection, Q, then a tall sharp UPWARD spike, R - the tallest point of the whole trace, then a small DOWNWARD deflection, S.
- Then another short flat stretch on the baseline.
- Then a broader rounded UPWARD wave - the T wave, lower and wider than R.
- Then the baseline again, until the next P wave begins the next cycle.
What each part means:
| Part of the trace | What it represents |
|---|---|
| P wave | the electrical excitation, or depolarisation, of the ATRIA, which leads to the contraction of both the atria |
| QRS complex | the depolarisation of the VENTRICLES, which initiates the ventricular contraction; the contraction starts shortly after Q and marks the BEGINNING of the systole |
| T wave | the repolarisation of the ventricles - their return from the excited to the normal state; the END of the T wave marks the END of the systole |
The whole pattern repeats once per cardiac cycle, so by counting the number of QRS complexes that occur in a given time period, one can determine the heart beat rate of an individual. And since ECGs from different individuals have roughly the same shape for a given lead configuration, any deviation from this shape indicates a possible abnormality or disease - which is why the ECG is of great clinical significance.
Question 10
Q. How is the heart beat rate obtained from an ECG?
Answer. By counting the number of QRS complexes that occur in a given time period. Each QRS complex belongs to one cardiac cycle, so the count over a known time gives the beats per minute.
Question 11
Q. An ECG trace shows 30 QRS complexes in 25 seconds. What is the heart rate?
Answer. 72 beats per minute. In 25 seconds there are 30 complexes, so in 60 seconds there are 30 multiplied by 60 divided by 25 = 72. Each QRS complex is one ventricular contraction, so the heart rate is 72 beats per minute - the normal value used in this chapter.
Question 12
Q. Why is an ECG of great clinical significance?
Answer. Because ECGs obtained from different individuals have roughly the same shape for a given lead configuration, so there is a normal pattern to compare with. Any deviation from this shape indicates a possible abnormality or disease, which lets a doctor detect a problem in the heart from the trace alone.
Question 13
Q. Which electrical event of the cardiac cycle has no wave of its own on a standard ECG?
Answer. Atrial repolarisation. The trace shows atrial depolarisation as the P-wave, ventricular depolarisation as the QRS complex and ventricular repolarisation as the T-wave, but the recovery of the atria is hidden inside the QRS complex and so is not seen separately.