
Where the Wave Picture Stops Working
Maxwell's equations describe light as an electromagnetic wave travelling at , with . Two phenomena show that picture is right:
- Diffraction — the bending of a wave around an obstacle or through a narrow slit. Only a wave bends round corners.
- Interference — when two waves meet, the disturbance at each point is the algebraic (vector) sum of the two individual disturbances. Crest on crest gives a bright fringe, crest on trough gives darkness. A stream of tiny bullets cannot produce Young's double-slit fringes.
By 1890 light was taken to be a wave. But four experiments refused to fit, and the physics of the nineteenth century — Newton's mechanics plus Maxwell's electromagnetism, together called classical physics — failed on all of them:
| # | Phenomenon | What was observed | Why it puzzled classical physics |
|---|---|---|---|
| (i) | Black-body radiation | The colour and intensity of light from a hot object change with temperature in a very specific way | Wave theory predicted the wrong intensity-wavelength curve (even infinite energy at short wavelengths) |
| (ii) | Photoelectric effect | Light shining on a metal knocks electrons out — but only if its frequency is high enough | Wave theory says energy depends on brightness, not frequency |
| (iii) | Heat capacity of solids | The heat capacity of a solid falls towards zero as temperature is lowered | Classical theory predicted a constant value (about per mole) at every temperature |
| (iv) | Line spectra of atoms | Hydrogen and other gases emit light only at certain sharp wavelengths, not a continuous rainbow | A classical electron could radiate at any frequency it liked |
Key Point: All four carry the same message: a system can take up or give out energy only in discrete amounts, not continuously. This idea — quantisation — is the doorway from classical to quantum physics.
This section covers the first two, which forced Planck and Einstein to treat light as packets. Line spectra come next and lead to Bohr's atom. Heat capacity belongs to physics; Einstein solved it with the same idea in 1907.
Classical versus quantum
- Classical physics treats energy as continuous. A wave can carry any amount of energy, however small, by being dim enough.
- Quantum physics says that for oscillators and radiation, energy comes in indivisible lumps — quanta. One lump, two lumps, a million lumps, but never one and a half.
Classical energy is water from a tap; quantum energy is coins from a vending machine. For everyday objects the coins are so tiny that the flow looks continuous. For atoms and light they are big enough to matter.
[Exam Tip] The set of things classical physics could not explain: black-body radiation, photoelectric effect, variation of heat capacity of solids with temperature, and line spectra of atoms. Diffraction and interference are the ones classical wave theory does explain.
Black-body Radiation — What Hot Objects Tell Us
Hot objects glow, and the colour depends on temperature
Every object above absolute zero emits electromagnetic radiation over a wide range of wavelengths. At room temperature almost all of it is infrared, which is why a warm cup of tea does not glow in the dark. Raise the temperature and two things happen: the object radiates more energy overall, and a larger proportion of it shifts to shorter wavelengths — into the visible and towards the blue end.
Push an iron rod into a furnace and you see it:
| Temperature | What you see | Where the emitted energy peaks |
|---|---|---|
| Around 500-600 °C | Faint dull red glow | Mostly infrared, just spilling into red |
| 800-1000 °C | Bright red, then cherry red | Red end of the visible |
| 1200-1500 °C | Yellow-white ("white hot") | Middle of the visible — all colours present |
| Above about 6000 K (a star's surface) | Bluish-white | Blue end and beyond, into the ultraviolet |
The intensities of the different wavelengths emitted by a hot body depend on its temperature. By the late 1850s it was also known that objects of different materials at different temperatures emit different amounts of radiation.
Why we need an ideal radiator
When light falls on an ordinary object, part is reflected, part absorbed and part transmitted. Ordinary objects are imperfect absorbers, so what they emit depends messily on surface, colour and material. To isolate the effect of temperature, physicists imagined an idealised object:
Key Point (Definition): A black body is an ideal body that emits and absorbs radiation of all frequencies uniformly. The radiation emitted by such a body is called black-body radiation.
Three properties follow:
- A black body is a perfect absorber — nothing is reflected, hence "black".
- It is also a perfect radiator of radiant energy.
- In thermal equilibrium with its surroundings it radiates exactly as much energy per unit area as it absorbs in any given time.
Since it reflects nothing, all the light coming off it is its own thermal emission. The intensity of radiation and its spectral distribution depend only on the temperature — not on the material or the surface finish.
No perfect black body exists in nature. Two practical stand-ins:
- Carbon black (soot) — absorbs almost everything falling on it.
- A cavity with a tiny hole and no other opening — the best approximation. A ray entering the hole is reflected back and forth by the walls until absorbed, and almost nothing escapes. Heat the cavity and the radiation leaking from the hole is black-body radiation at the cavity's temperature.
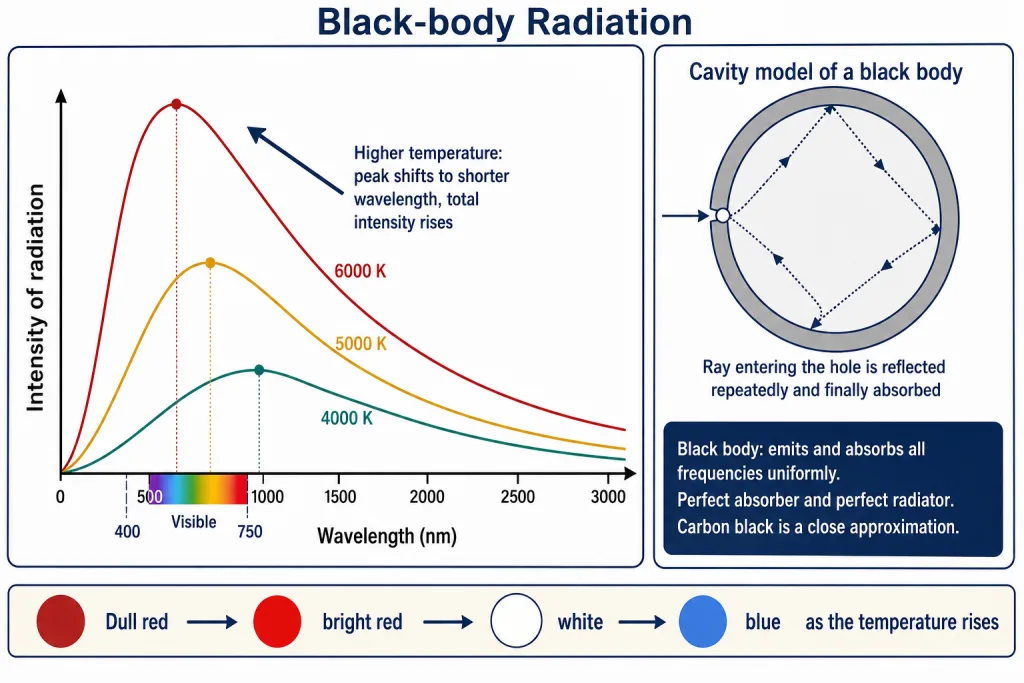
The intensity-wavelength curve
Measure the intensity coming out of the hole at each wavelength and plot it. At a fixed temperature the curve rises from short wavelengths, reaches a maximum at one wavelength , then falls away into the far infrared.
Repeat at a higher temperature and two things change:
- The whole curve sits higher — more energy at every wavelength.
- The maximum shifts to shorter wavelength, moving from red through yellow towards blue.
Key Point: As temperature increases, the total intensity of black-body radiation increases and shifts to shorter wavelengths (higher frequencies).
[JEE Main] Wien's displacement law gives the shift: constant ( m K). A 6000 K star peaks near 480 nm; a 3000 K bulb filament peaks near 970 nm, in the infrared — which is why incandescent bulbs waste most of their energy as heat.
The problem: waves get the curve wrong
Attempts in the 1890s to predict this curve from wave theory could match the long-wavelength tail or the short-wavelength side, never the whole curve. The most careful classical calculation (Rayleigh and Jeans) predicted intensity increasing without limit at short wavelengths — a hot object pouring out unlimited ultraviolet and X-rays. It does not; the failure was nicknamed the "ultraviolet catastrophe". The black-body results could not be explained on the basis of the wave theory of light. That is where Max Planck comes in.
Planck's Quantum Theory (1900)
Planck's bold assumption
Max Planck (1858-1947), at the University of Berlin, found the relationship that fits the black-body curve at every wavelength and every temperature — but only by breaking with classical physics.
He modelled the atoms in the wall of the black body as tiny oscillators, whose frequency of oscillation changes as they interact with the oscillating electromagnetic field. The radical step came next:
Key Point: Planck assumed that radiation can be sub-divided into discrete chunks of energy. Atoms and molecules can emit or absorb energy only in discrete quantities, not in a continuous manner. The smallest quantity of energy that can be emitted or absorbed as electromagnetic radiation he called a quantum.
The energy of one quantum of radiation is proportional to its frequency :
The proportionality constant is Planck's constant:
Its units are joule × second, since energy divided by frequency (per second) gives energy × second. That tiny number is why the graininess of energy is invisible in daily life — one quantum of visible light carries only about J.
With this assumption Planck explained the distribution of intensity in black-body radiation as a function of frequency (or wavelength) at different temperatures. He received the Nobel Prize in Physics in 1918.
The staircase picture:
An oscillator of frequency cannot have just any energy. It can have
and nothing in between. On a ramp (classical) you can stop at any height; on a staircase (quantum) only certain heights are allowed, and the step height is .
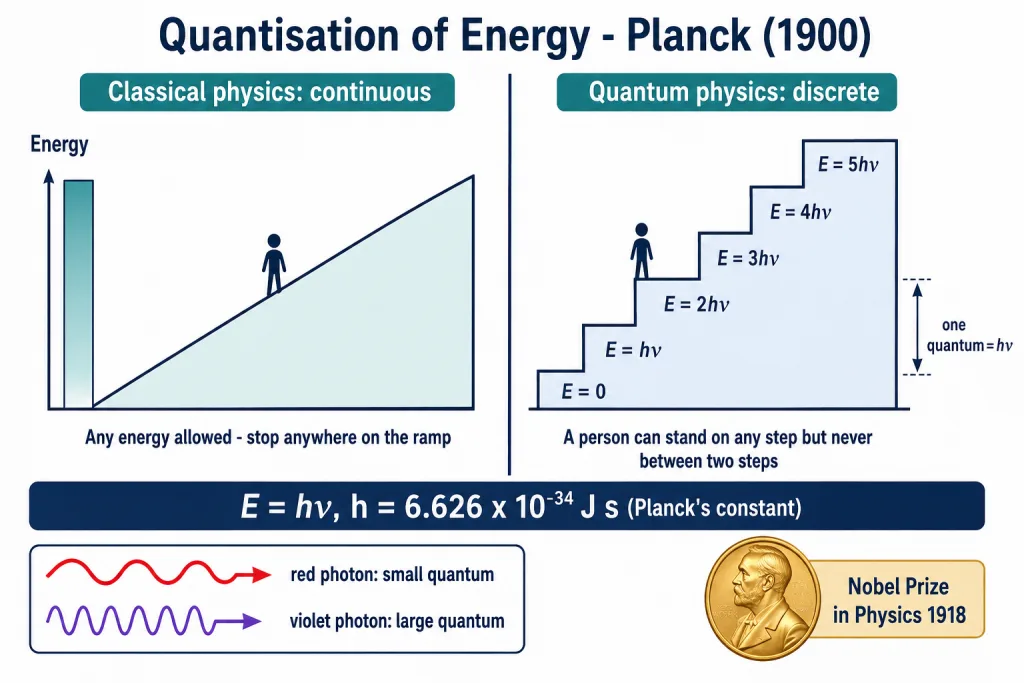
This does not say the energy is small — can be enormous. A 100 W bulb emits about quanta every second, so its light looks continuous. It says the energy is granular: a whole number of identical packets of size . Higher frequency means a bigger packet, so an ultraviolet quantum is a bigger coin than a red one.
Three forms of
Because and , the same relation has three forms. Use whichever matches the data given:
| Given | Formula | Comment |
|---|---|---|
| Frequency | Direct | |
| Wavelength | Most common in problems; in metres | |
| Wavenumber | in (convert from by multiplying by 100) |
The product is worth memorising in two unit systems:
[JEE Main] A 400 nm photon carries eV; a 620 nm photon carries 2.00 eV; a 1240 nm photon carries exactly 1 eV. When a work function is quoted in eV, work entirely in eV and nm, and convert to joules (1 eV J) only if the final answer needs it.
Energy of a mole of photons
One photon's energy is tiny, so chemists often quote the energy of one mole of photons — an "einstein" of radiation. Multiply by the Avogadro constant:
For green light of Hz this is about 200 kJ per mole — comparable to a chemical bond energy. That is why visible and ultraviolet light can drive photochemical reactions such as photosynthesis and the fading of dyes, while infrared light only warms things up.
Key Point: is the energy of one photon. Energy of photons . Energy of one mole of photons . Number of photons emitted per second by a source of power . Keep "per photon" and "per mole" separate.
The Photoelectric Effect — Hertz's Experiment (1887)
What was observed
In 1887 Heinrich Hertz noticed that light falling on a metal surface made it easier for sparks to jump from it. Follow-up experiments showed why. When certain metals — potassium, rubidium, caesium and other reactive metals in particular — are exposed to a beam of light, electrons are ejected from the metal surface. This is the photoelectric effect, and the ejected electrons are photoelectrons.
The apparatus is simple. A clean metal plate sits inside an evacuated glass tube, so electrons are not scattered by air. Light of a chosen frequency shines on it, the ejected electrons travel to a collector plate, and an ammeter measures the current. A retarding voltage lets the detector measure their kinetic energy too.
Key Point (The three observations):
- No time lag. Electrons are ejected as soon as the beam strikes the surface, with no delay, however dim the light.
- Number of electrons ∝ intensity. The number of electrons ejected per second is proportional to the intensity (brightness) of the light.
- Threshold frequency. Each metal has a characteristic minimum frequency , the threshold frequency, below which the photoelectric effect is not observed at all. For the ejected electrons carry kinetic energy, and this kinetic energy increases with the frequency of the light, not with its intensity.
Why classical physics could not explain this
In wave theory the energy carried by a beam depends on its brightness (the amplitude of the wave). A brighter beam should eject more electrons and eject them faster, and a dim beam of any frequency should eventually shake an electron loose after a time lag while it soaks up energy.
Every one of these expectations fails:
| Classical prediction | What actually happens |
|---|---|
| Kinetic energy of photoelectrons should rise with brightness | Kinetic energy depends on frequency only; brightness has no effect on it |
| Any frequency should work if the light is bright enough | Below , nothing happens, however bright the light |
| Dim light should need time to accumulate energy — a time lag | Emission is instantaneous, even in very dim light |
| Number of electrons should depend on brightness | Number of electrons does depend on brightness — the one prediction that survives |
The potassium experiment makes the failure vivid. Red light ( to Hz) of any brightness can shine on potassium for hours without ejecting a single photoelectron. Very weak yellow light ( to Hz) on the same potassium produces the effect at once. The threshold frequency of potassium is Hz: red is below it, yellow is above it, and no amount of red intensity makes up the difference.
A wave cannot do this. If energy arrived spread out, a bright red beam would deliver far more energy per second than a feeble yellow one and would win. The size of the pieces the energy arrives in matters more than how much arrives per second.
[NEET] The potassium numbers are worth memorising. Its threshold wavelength is m nm, so light longer than about 600 nm cannot eject electrons from potassium. The work-function table below gives eV for potassium, i.e. nm; both figures are quoted, because a work function depends on the condition of the metal surface.
Threshold: frequency, not intensity
- The threshold is a frequency (equivalently a maximum wavelength ). It is a property of the metal, not of the light.
- Below the threshold, increasing the intensity does nothing. Above it, more intensity means more electrons but not more kinetic energy.
- Different metals have different thresholds. The alkali metals (K, Rb, Cs) have the lowest, so visible light works on them, which is why they are used in photocells. Copper and silver need ultraviolet light.
Einstein's Explanation (1905) — Light as Photons
The photon idea
Planck had applied his quantum hypothesis only to the oscillators in the walls of a black body. Einstein applied it to light itself. Light of frequency , he proposed, is not a continuous wave spread over space but a stream of particles — photons — each carrying one quantum of energy, . Shining light on a metal is then shooting a beam of particles at it.
Every observation now fits:
- No time lag. A photon of sufficient energy transfers its energy instantaneously to an electron during the collision. The electron receives the whole packet at once and leaves without delay.
- Threshold frequency. A minimum energy is needed to pull an electron out. A photon carrying less cannot eject it, however many such photons arrive. That minimum energy corresponds to a minimum frequency .
- Kinetic energy rises with frequency. A higher-frequency photon carries more energy and transfers more to the electron, which leaves with more kinetic energy.
- Number of electrons rises with intensity. A more intense beam contains more photons, so more electrons are ejected — but each collision is still one photon with one electron, so the energy per electron is unchanged.
Work function and Einstein's photoelectric equation
Key Point (Definition): The minimum energy required to eject an electron from the surface of a metal is called its work function, . It equals the energy of a photon at the threshold frequency:
The striking photon has energy and the escape costs , so the difference goes to the electron as kinetic energy. By conservation of energy:
where is the electron mass and its velocity. The equation is a budget: photon energy in = cost of escape + kinetic energy left over. Strictly, is the energy needed for the most loosely bound surface electrons, so is the maximum kinetic energy; deeper electrons come out slower.
Work functions are usually quoted in electron-volts:
| Metal | Li | Na | K | Mg | Cu | Ag |
|---|---|---|---|---|---|---|
| / eV | 2.42 | 2.3 | 2.25 | 3.7 | 4.8 | 4.3 |
The alkali metals have the smallest work functions — the single valence electron is loosely held, so visible light (1.65-3.1 eV) suffices. Copper and silver, above 4 eV, need ultraviolet shorter than about nm. The threshold wavelength of any metal is
which for potassium gives nm — consistent with red (700 nm) failing and yellow (580 nm) working.
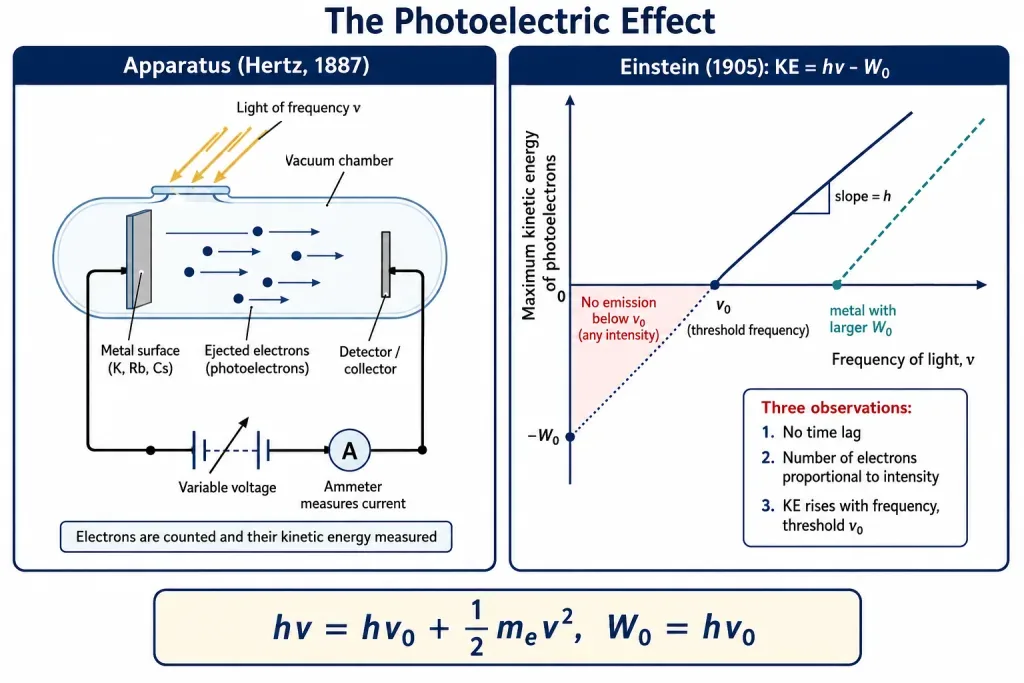
Kinetic energy against frequency
Plot the maximum kinetic energy of the photoelectrons against frequency. Einstein's equation, , is a straight line:
- Slope , the same for every metal. Millikan, who set out to disprove Einstein, measured Planck's constant this way to within 0.5% in 1916.
- Intercept on the frequency axis ; different metals give parallel lines cutting the axis at different places.
- Intercept on the energy axis (extrapolated) .
- Changing the intensity does not move the line; it only changes the current.
[JEE Main] In the laboratory the kinetic energy is measured with a reverse voltage that just stops the fastest electrons — the stopping potential . Then , and the equation becomes . Plotting against gives a straight line of slope .
Intensity versus frequency: two dials
| Turn up… | Effect on number of photons | Effect on energy per photon | Effect on photoelectrons |
|---|---|---|---|
| Intensity (brightness) | More photons per second | Unchanged | More electrons per second (larger current); same maximum KE |
| Frequency (colour) | Unchanged (at fixed power, actually fewer) | Larger () | Same number of electrons; each with more KE |
Einstein received the Nobel Prize in Physics in 1921 for this explanation, not for relativity. The paper was one of three he published in 1905 while working in the Swiss patent office in Berne.
Dual Behaviour of Radiation, and a Problem-Solving Toolkit
The dilemma and its resolution
Photons explain black-body radiation and the photoelectric effect; but a stream of particles cannot produce interference fringes or diffract round an obstacle, which need a wave. Both sets of experiments are correct.
The only resolution was to accept that light possesses both particle-like and wave-like properties — light has a dual behaviour. Which one shows up depends on the experiment:
| When light… | It shows… | Examples |
|---|---|---|
| propagates through space | wave-like properties | interference, diffraction, refraction, polarisation |
| interacts with matter (is emitted or absorbed) | particle-like properties | black-body radiation, photoelectric effect, line spectra |
Two sections from now you will see that microscopic particles such as electrons show the same wave-particle duality, and that is what finally makes sense of the atom.
Key Point: Radiation is neither purely a wave nor purely a particle. The wave description works for propagation; the photon description works for exchange of energy with matter. Neither alone is complete.
Formula sheet for this section
| Quantity | Formula | Units / values |
|---|---|---|
| Energy of one photon | J s; J m | |
| Photon energy shortcut | eV nm | |
| Energy of one mole of photons | ||
| Number of photons | ; per second: | in W = J s |
| Work function | eV or J; 1 eV J | |
| Einstein's equation | kg | |
| Photoelectron speed | m s | |
| Stopping potential | in eV = in volts |
Unit conversions
- m; m; m; m.
- Wavenumber in : multiply by 100 to get .
- J; from J to eV, divide by .
- 1 W . A 100 W bulb delivers 100 J every second.
- Velocities quoted in : divide by 100 to get before using with in kg.
Five costly mistakes
- Using in nm inside with in J m. Convert to metres or switch to the 1240 eV nm shortcut. Never mix.
- Confusing "per photon" with "per mole". A work function in must be divided by before comparing with one photon's energy in J.
- Thinking brighter light gives faster electrons. It gives more electrons; only higher frequency gives faster ones.
- Forgetting that below threshold nothing happens. If the kinetic energy is not negative — the electron is simply not emitted. Check (or ) before computing a speed.
- Mixing up and . Threshold frequency is a minimum; threshold wavelength is a maximum. Light works if , i.e. if .
[Board] Two definitions to learn word-perfect: threshold frequency (the minimum frequency of radiation below which no photoelectrons are emitted from a given metal, however intense the light) and work function (the minimum energy required to eject an electron from the surface of a metal, ).
Solved Examples
Question 1: Energy of a mole of photons
Calculate the energy of one mole of photons of radiation whose frequency is Hz.
Answer:
Energy of one photon: J.
I scale up to a mole with the Avogadro constant.
Ans: (about J per photon). Watch out: The question asks for a mole, not one photon — the step is where marks go.
Question 2: Photons per second from a 100 W bulb
A 100 watt bulb emits monochromatic light of wavelength 400 nm. Calculate the number of photons emitted per second by the bulb.
Answer:
Power is energy per second, so 100 W . Energy of one 400 nm photon:
Dividing energy per second by energy per photon:
Ans: About photons every second. Watch out: must be in metres before it meets in J m.
Question 3: Quanta per second from a 25 W yellow bulb
A 25 watt bulb emits monochromatic yellow light of wavelength 0.57 μm. Calculate the rate of emission of quanta per second.
Answer:
In metres, m. Energy of one photon:
Ans: About quanta per second.
Question 4: Photon energies and photon counting across the spectrum
(i) Find the energy of a photon of light of frequency Hz. (ii) Find the energy of a photon of wavelength 0.50 Å. (iii) How many photons of light of wavelength 4000 pm are needed to provide 1 J of energy?
Answer:
(i) J, an ultraviolet photon of about 12.4 eV.
(ii) m, so
an X-ray photon of roughly 24,800 eV.
(iii) m. I find the energy of one photon and divide 1 J by it.
Ans: (i) J; (ii) J; (iii) photons. Watch out: Convert every length to metres first (, pm ).
Question 5: Power of a nitrogen laser
A nitrogen laser produces radiation at a wavelength of 337.1 nm. If the number of photons emitted is , calculate the power of this laser.
Answer:
Energy per photon:
Total energy: J.
Power is energy per unit time, and no time is given, so I take the photons as emitted per second:
Ans: W (3.3 MW), taking the photon count as per second. Watch out: State the one-second assumption when the question is silent about time.
Question 6: Two photon-counting puzzles — starlight and a pulsed source
(i) A photon detector pointed at a distant star receives a total of J of radiation of wavelength 600 nm. How many photons did it receive? (ii) A pulsed radiation source has a pulse duration of 2 ns and emits photons during the pulse. Calculate the energy of the source.
Answer:
(i) Energy of a 600 nm photon: J.
photons, since a photon count must be a whole number.
(ii) I take the pulse duration as the period of the radiation:
Energy per photon: J.
Energy of the pulse: J.
Ans: (i) About 10 photons; (ii) J. Watch out: Part (ii) uses frequency . Given a wavelength instead, use .
Question 7: Kinetic energy from threshold and incident frequency
The threshold frequency for a metal is . Calculate the kinetic energy of an electron emitted when radiation of frequency hits the metal.
Answer:
is greater than , so electrons are ejected. Einstein's equation gives :
Ans: J (about 1.24 eV). Watch out: Subtract the frequencies first, then multiply by — one multiplication instead of two.
Question 8: Sodium, 300 nm light, and the threshold wavelength
When electromagnetic radiation of wavelength 300 nm falls on the surface of sodium, electrons are emitted with a kinetic energy of . What is the minimum energy needed to remove an electron from sodium? What is the maximum wavelength that will cause a photoelectron to be emitted?
Answer:
Energy of a 300 nm photon:
The kinetic energy is given per mole, so I put the photon energy on a per-mole footing:
Photon energy = work function + kinetic energy, so
Per electron, J, about 2.4 eV.
At the maximum wavelength the photon energy is exactly :
Ans: Minimum energy ( J per electron); maximum wavelength 517 nm. Watch out: Do the subtraction per mole and divide by only at the end. "Maximum wavelength" and "threshold wavelength" are the same thing.
Question 9: Photon energy, kinetic energy and speed with the 1240 shortcut
A photon of wavelength m strikes a metal surface whose work function is 2.13 eV. Calculate (i) the energy of the photon in eV, (ii) the kinetic energy of the emitted electron, and (iii) the velocity of the photoelectron. (1 eV J.)
Answer:
(i) m nm, so
(The long way, J, gives the same 3.10 eV.)
(ii) eV. For the speed I need joules: J.
(iii) From ,
Ans: (i) 3.10 eV; (ii) 0.97 eV ( J); (iii) . Watch out: Stay in eV as long as possible; convert to joules only for the step.
Question 10: Ionisation energy of sodium from a wavelength
Electromagnetic radiation of wavelength 242 nm is just sufficient to ionise the sodium atom. Calculate the ionisation energy of sodium in .
Answer:
"Just sufficient" means threshold, so the photon energy equals the ionisation energy of one atom.
(Shortcut check: eV J.)
Per mole: .
Ans: About (5.12 eV per atom). Watch out: Ionising a free atom and ejecting an electron from a metal are the same calculation, but the numbers differ (5.1 eV for a free Na atom against 2.3 eV for the metal).
Question 11: Threshold frequency and work function from zero-velocity emission
Electrons are emitted with zero velocity from a metal surface when it is exposed to radiation of wavelength 6800 Å. Calculate the threshold frequency and the work function of the metal.
Answer:
Zero velocity means zero kinetic energy, so this light is exactly at threshold: Å m.
In eV: eV, or directly eV.
Ans: Hz; J eV. Watch out: "Emitted with zero velocity" is code for "this wavelength is the threshold".
Question 12: Caesium — threshold wavelength, threshold frequency, and 500 nm light
The work function of caesium is 1.9 eV. Calculate (a) the threshold wavelength and (b) the threshold frequency of the radiation. If caesium is irradiated with light of wavelength 500 nm, calculate the kinetic energy and the velocity of the ejected photoelectron.
Answer:
Work function in joules: J.
(a)
(Shortcut: nm. Red light works on caesium.)
(b) Hz.
For the 500 nm light, eV J. Since 500 nm is shorter than 653 nm, emission occurs.
eV J.
Ans: (a) nm; (b) Hz; eV J; . Watch out: Follow the chain in order, , and do the eV arithmetic first.
Question 13: Work function of silver from a stopping potential
The ejection of photoelectrons from silver can be stopped by applying a voltage of 0.35 V when radiation of wavelength 256.7 nm is used. Calculate the work function of silver.
Answer:
A reverse voltage of 0.35 V just stops the fastest electrons, so eV.
Energy of the 256.7 nm photon:
In joules, J.
From Einstein's equation, eV J.
Ans: eV ( J), close to the tabulated 4.3 eV for silver. Watch out: The stopping potential in volts is the maximum kinetic energy in electron-volts — no conversion at that step.
Question 14: Finding Planck's constant from photoelectric data
When sodium metal is irradiated with light of different wavelengths, the following maximum photoelectron velocities are observed:
| (nm) | 500 | 450 | 400 |
|---|---|---|---|
| () | 2.55 | 4.35 | 5.35 |
Calculate (a) the threshold wavelength and (b) Planck's constant.
Answer:
For each wavelength, , that is .
(a) I eliminate by taking a ratio. Dividing the 500 nm equation by the 450 nm one cancels , the factor and the velocity units:
With in nm, and . Writing :
(b) The tabulated velocities are to be read as , and — read literally in they would be times too small to be photoelectrons at all. With kg:
| (nm) | () | () | (J) |
|---|---|---|---|
| 500 | |||
| 450 | |||
| 400 |
The slope of against is . From the two outer points:
A least-squares fit through all three points gives J m. Dividing by :
Ans: (a) nm; (b) J s (about 6.7 from the two-point estimate), within 1% of the accepted J s. Watch out: The ratio trick gives without knowing . Real data are noisy, so use a best-fit line rather than a single pair of points.
Question 15: Binding energy of an inner electron hit by an X-ray photon
A photon of wavelength 150 pm strikes an atom and one of its inner bound electrons is ejected with a velocity of . Calculate the energy with which the electron was bound to the nucleus.
Answer:
This is Einstein's equation for an atom rather than a metal: photon energy = binding energy + kinetic energy.
With m,
In electron-volts: eV keV.
Ans: About J, roughly 7.6 keV. Watch out: Line up the powers of ten before subtracting. Inner-shell electrons are bound in keV, not eV, which is why an X-ray photon is needed.