
One Gas, a Hundred Billion Different Speeds
The previous section handed us a single number and called it the speed of a nitrogen molecule at 300 K: m/s. Now let us admit what that number was hiding.
No molecule is obliged to move at 517 m/s. In any real sample, at this instant, some molecules are crawling along at 40 m/s and some are tearing about at 1500 m/s, and a collision a nanosecond from now will change both. A molecule's speed is not a property it has; it is something that happens to it, over and over, two billion times a second.
So what survives? Not any individual speed — but the proportions. At a fixed temperature, the fraction of molecules moving between, say, 400 m/s and 500 m/s is a rock-steady number, even though the particular molecules occupying that band are swapped out constantly. Individual speeds churn; the distribution of speeds does not budge.
Key Point: A gas in equilibrium has a fixed distribution of molecular speeds, even though no individual molecule keeps its speed for more than a nanosecond. Every collision that removes a molecule from one speed range puts another one into it. This steady spread is what we are about to describe, and it is what was a single crude summary of.
James Clerk Maxwell worked out the shape of that spread in 1859, and Ludwig Boltzmann later derived it from more general principles — which is why it is called the Maxwell-Boltzmann distribution of molecular speeds.
A note on where this sits. The speed distribution and the formulas for the average and most probable speeds sit outside the body text of the rationalised syllabus, but Boards, JEE and NEET ask for the shape of the curve, the ordering of the three speeds and their ratio every single year — so they are developed here in full.
What the curve actually plots
Write for the speed distribution function. It is defined so that
Two consequences follow immediately, and everything else in this section is built on them.
Key Point — how to read a distribution curve:
- The area under the whole curve is 1, because every molecule has some speed:
- The area between two speeds is the fraction of molecules in that range:
It is the area that carries the meaning, not the height. The height on its own is a fraction per unit speed range — you cannot read a number of molecules off it without choosing a width.
[JEE Tip] This is the single most common misreading in the whole topic. "What fraction of molecules move at exactly 500 m/s?" has the answer zero — a single speed is a line of zero width, and a line encloses no area. Every meaningful question about the distribution is a question about a range.
The shape, and why it has that shape
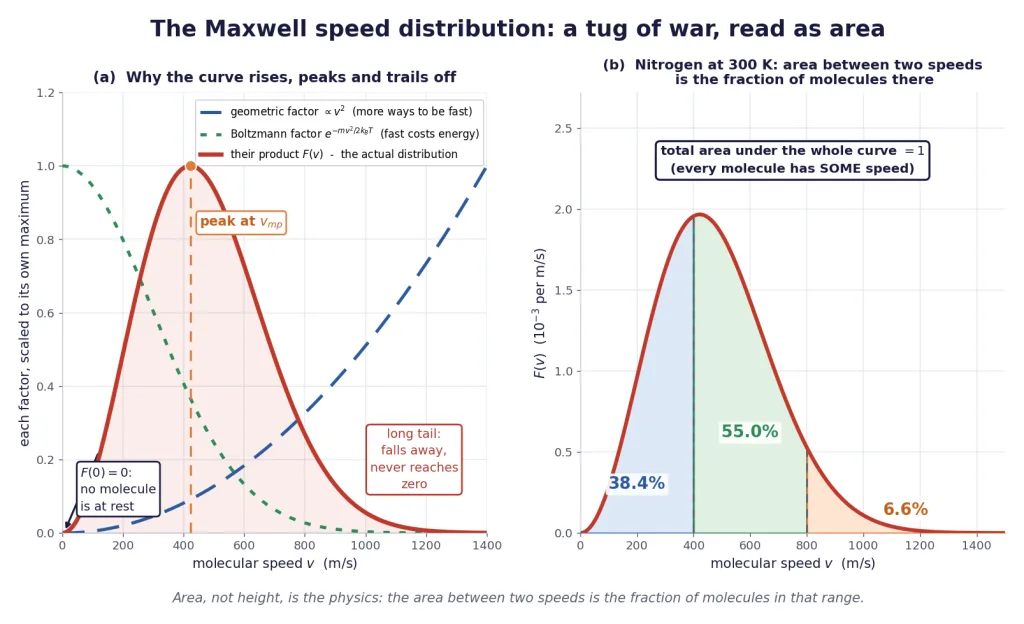
Written out, the distribution is
You are not asked to reproduce that. You are asked to know its shape, and the shape is decided by a tug of war between the only two parts that depend on :
1. The factor pushes the curve up. Velocity is a three-dimensional vector, and there are far more ways to have a large speed than a small one — think of all the directions a fast molecule could be pointing. The number of available velocity states grows as , which is why the curve climbs at first.
2. The exponential pulls it down. Going fast costs kinetic energy, and at temperature the supply of energy is limited. This Boltzmann factor makes high speeds exponentially unlikely.
Multiply the two and you get the lopsided hump in the figure:
- It starts at zero. At the factor is zero, so . No molecules are at rest. A molecule with exactly zero speed would have to have all three velocity components exactly zero at once, and there is precisely one way to do that against infinitely many ways to be moving.
- It rises to a single peak. The peak is where the two factors balance, and the speed at which it sits gets a name in a moment.
- It falls away with a long tail, and it is NOT symmetric. Past the peak the exponential wins and the curve drops — but it never reaches zero. There is always some fraction of molecules at any speed you care to name, however large. The curve is squashed against the wall at on the left and free to run on forever to the right, so it cannot possibly be a symmetric bell.
[Board Important] "The Maxwell distribution is a symmetric bell curve about " is false, and it is offered as a distractor constantly. It is asymmetric, it starts at the origin, and its peak is at neither the mean nor the rms speed.
Reading a real number off it
Panel (b) of the figure is nitrogen at 300 K, cut into three bands. Those percentages are not decorations — each is the area of its band, and they were obtained by integrating :
| Speed range for nitrogen at 300 K | Fraction of molecules |
|---|---|
| slower than 400 m/s | 38.4% |
| between 400 and 800 m/s | 55.0% |
| faster than 800 m/s | 6.6% |
| all speeds | 100% |
Notice the arithmetic: , exactly, because the three bands between them cover every possible speed. Any question that gives you two of these and asks for the third is asking you to subtract from 100%.
How the Curve Moves
The curve is not one fixed shape. It has exactly two knobs: the temperature and the molar mass. Learn what each does and you can answer most graph questions on this topic without calculating anything.
Knob 1: raise the temperature
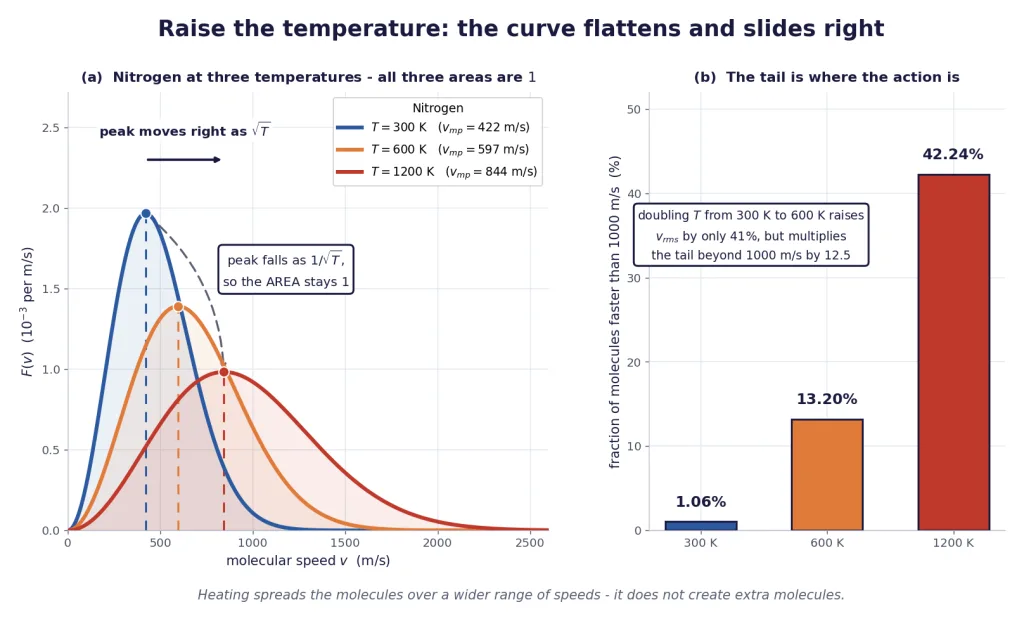
Heat the gas up and three things happen together:
- The peak moves to the right. Molecules get faster, so the commonest speed rises — and it rises as , like every other speed in this chapter.
- The peak gets lower.
- The curve gets broader — the speeds spread out over a wider range.
Points 2 and 3 are not independent, and this is the part worth understanding rather than memorising.
Key Point — why heating LOWERS the peak:
The area under the curve must stay equal to 1, because heating a sealed gas does not create or destroy a single molecule. If the curve spreads sideways, it must sag downwards to keep the same area. The curve flattens and shifts right; it does not simply slide right.
That constraint is exactly why the figure's three curves, at 300 K, 600 K and 1200 K, all enclose the same area even though they look so different. The peak height falls as while the width grows as , and the product — the area — never changes.
[JEE Tip] A graph question showing two Maxwell curves at different temperatures where the hotter one is both taller and wider is showing you an impossible gas. Check the areas first; it is often the whole question.
What flattening does to the tail
Look at panel (b) of that figure, because it holds the most useful fact in the section.
| Nitrogen at | Fraction of molecules faster than 1000 m/s |
|---|---|
| 300 K | 1.06% |
| 600 K | 13.20% |
| 1200 K | 42.24% |
Doubling the temperature from 300 K to 600 K raises by only , a modest 41%. But it multiplies the number of molecules beyond 1000 m/s by 12.5. The tail responds far more violently than the average does, and that single sentence is the explanation of evaporation, of atmospheric escape and of chemical reaction rates, which close this section.
Knob 2: change the gas
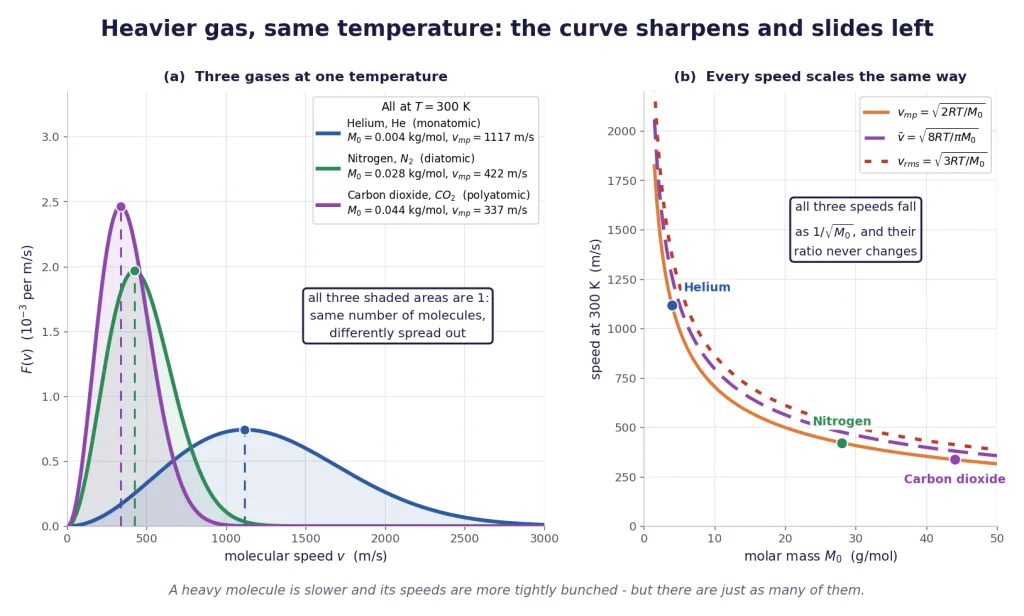
Now hold the temperature fixed and swap in a heavier gas. Everything runs backwards:
Key Point — heavier gas at the same temperature:
The curve sharpens and shifts left. A heavier molecule is slower (all speeds go as ), so the peak moves left; and since the area is still 1, a narrower curve must be a taller one. Light gas: broad, low, far to the right. Heavy gas: narrow, tall, hugging the left.
The figure shows helium ( kg/mol), nitrogen () and carbon dioxide () all at 300 K. Helium's curve sprawls out past 2500 m/s; carbon dioxide's is a sharp spike near 340 m/s. Same temperature, same average kinetic energy per molecule, wildly different speeds — exactly what the previous section promised.
The two knobs on one line
- Raise four times and every speed doubles, and the curve flattens and stretches right.
- Use a gas four times heavier and every speed halves, and the curve sharpens and squeezes left.
- Raise four times AND use a gas four times heavier and the curve is identical to what you started with. Only the ratio matters.
[NEET Important] That last line is a favourite. Oxygen at 1200 K has exactly the same speed distribution as helium at 150 K, because . Check the ratio before you compute anything.
The Three Characteristic Speeds
A whole curve is awkward to carry around, so we summarise it with numbers. The trouble is that a lopsided curve has no single obvious centre — and three perfectly reasonable definitions give three different answers.
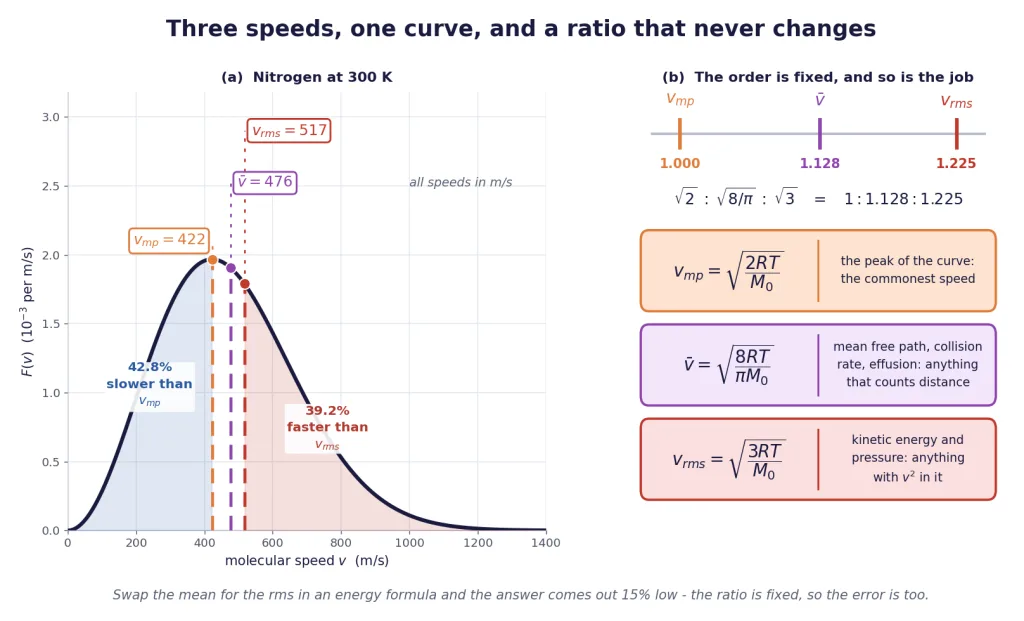
1. The most probable speed,
The speed at the peak of the curve — the single commonest speed in the gas, the one more molecules have than any other. Find it by setting , and it comes out at
2. The average (mean) speed,
Add up every molecule's speed and divide by the number of molecules. As an integral over the distribution, , and the answer is
That stray in the denominator is the giveaway that you are looking at the mean speed and not something else. It is the only one of the three with a in it.
3. The root mean square speed,
Already derived in the previous section from , and repeated here only so the family is together:
The ordering and the ratio — memorise this line
Strip out the common and all that is left is the numerical coefficient: , , . Since , the order can never change.
Key Point — the three speeds, in order, always: This ratio is a pure number. It does not depend on the gas, on the temperature, on the pressure or on anything else. Know one of the three speeds and you know the other two by multiplication.
Two more forms of the same fact, both worth having ready:
So and differ by only about 8.5% — close enough that swapping them is easy, and far enough apart that a marker will notice.
[NEET Important] The mnemonic that survives exam pressure: "most probable is the smallest, rms is the biggest, mean is in the middle", and . If you can only hold one number, hold — that is , the jump from straight to .
The numbers, at 300 K
Note that every row is in the ratio — read down any column and you see the law; read across any row and you see the fixed ratio.
| Gas | (kg/mol) | (m/s) | (m/s) | (m/s) |
|---|---|---|---|---|
| Hydrogen, H | 0.002 | 1579 | 1782 | 1934 |
| Helium, He | 0.004 | 1117 | 1260 | 1368 |
| Nitrogen, N | 0.028 | 422 | 476 | 517 |
| Oxygen, O | 0.032 | 395 | 445 | 484 |
| Carbon dioxide, CO | 0.044 | 337 | 380 | 412 |
And for air at STP — 273 K, with an average molar mass of kg/mol — the three come out as m/s, m/s and m/s. Keep those three straight: the mean-free-path section uses 447 m/s, and 485 m/s is the rms value for the same air. They are not interchangeable.
Where each one sits on the curve
The three speeds cut the distribution into pieces whose sizes are, remarkably, the same for every gas at every temperature — because the whole curve just stretches, and the three markers stretch with it.
| Region | Fraction of molecules |
|---|---|
| slower than | 42.8% |
| between and | 10.5% |
| between and | 7.5% |
| faster than | 39.2% |
[JEE Tip] Read the first and last rows again. Fewer than half the molecules are slower than the most probable speed, and nearly 40% are faster than the rms speed. That is what asymmetry does: the long tail on the right drags both and up above the peak, so neither of them is a "halfway" speed. The median speed is not any of the three.
Which Speed Does Which Job
Three speeds, three jobs. Pick the wrong one and your answer is wrong by a fixed, embarrassing, easily-spotted percentage.
Key Point — the assignment, and it is not negotiable:
- for anything built on — kinetic energy , the pressure , the temperature relation . Energy is quadratic in speed, so the mean of the squares is what the physics actually contains.
- for anything that counts distance travelled — the mean free path, the collision frequency , the collision time , effusion and diffusion rates. These count how far a molecule gets per second, and that is an ordinary average of speed.
- when the question is about the peak — the commonest speed, the position of the maximum, or scaling a curve.
What goes wrong when you swap them
Because the ratio is fixed, so is the error. These three numbers are worth knowing, because recognising one of them in a wrong answer tells you instantly what happened.
- Using where belongs, in an energy formula. You compute instead of , and since , your energy comes out 15.1% too low. Every time.
- Using where belongs, in a collision count. The collision frequency comes out times too big — 8.5% too high.
- Quoting where was wanted. That is a factor of , so the answer is 18.4% too low.
[JEE Tip] If a numerical answer is out by roughly 8.5%, 15% or 18%, and everything else looks right, you have used the wrong molecular speed. Check that before you check your arithmetic.
The heart of it: is not
Everything above rests on one piece of mathematics that has nothing to do with gases, and it is worth doing with numbers you can count on your fingers.
Take two molecules, one at 300 m/s and one at 500 m/s.
Route A — average first, then square.
Route B — square first, then average.
, and . Squaring and averaging do not commute.
Try it with five molecules at 200, 400, 600, 800 and 1000 m/s and the gap widens:
Key Point: always, with equality only if every molecule has exactly the same speed. The difference is the spread of the speeds, and it is never negative. That is why , always — the ordering of the three speeds is a mathematical fact about spread, not a special property of gases.
Squaring punishes the fast molecules more than it rewards the slow ones: doubling a speed quadruples its square. So the fast tail pulls up harder than it pulls up, and ends up on top.
For the Maxwell distribution in particular, the gap is fixed:
Take the square root of and you get — the same from the previous block, arriving by a different road.
[Board Important] A two-mark question that reads "show with an example that the mean square speed is not the square of the mean speed" wants exactly the two-molecule calculation above. Write both routes out, get against , and say the difference is the spread. Full marks.
The Tail That Runs the World
The average speed of a gas explains very little. The tail — the small fraction of molecules moving far faster than average — explains a surprising amount, and it does so because it is so exquisitely sensitive to temperature.
Here is how thin the tail is, for any gas at any temperature, measured in multiples of the most probable speed:
| Molecules faster than | Fraction |
|---|---|
| 57.2% | |
| 4.6% | |
| , about 1 in 2300 | |
| , about 1 in 2 million | |
| , about 1 in 12 billion |
The fall is savage — but it never reaches zero, and warming the gas slides the whole curve right underneath these fixed thresholds, which is where the drama comes from.
1. Evaporation, and why it cools
A puddle of water at 30°C is nowhere near its boiling point, yet it dries up. Why?
Because the molecules in it also have a distribution of speeds, and only the ones at the very top of the tail have enough kinetic energy to break free of the attractions holding the liquid together. Those escape. The ones left behind are, by construction, the slower ones — so the average kinetic energy of the remaining liquid drops, and the liquid gets colder. That is why sweat cools you, why a wet earthen pot keeps water cool, and why blowing across hot tea works: you sweep away the escaped fast molecules before they can come back, so the escaping continues.
Warm the puddle and the tail beyond the escape threshold swells enormously — which is why evaporation speeds up so sharply with temperature, long before boiling.
2. Why Earth has no hydrogen but plenty of nitrogen
To leave Earth for good, a molecule high in the atmosphere needs the escape speed, about km/s. Up in the exosphere the temperature is around 1000 K. Compare two gases there:
| Gas at 1000 K | escape speed in units of | Fraction fast enough to escape | |
|---|---|---|---|
| Hydrogen, H | 2883 m/s | 3.9 | about |
| Helium, He | 2039 m/s | 5.5 | about |
| Nitrogen, N | 771 m/s | 14.5 | about |
For hydrogen, roughly one molecule in a million is fast enough at any moment — and over billions of years, with collisions constantly refilling the tail, that is more than enough to strip the planet bare. For nitrogen the fraction is , which over the age of the universe is indistinguishable from never. Earth kept its nitrogen and oxygen and lost its hydrogen and helium, and the entire explanation is where those numbers sit in the tail.
[NEET Important] The Moon has no atmosphere for the same reason with the numbers pushed further: its escape speed is only about km/s, so even nitrogen and oxygen sit near enough to the top of the tail to have leaked away. Jupiter, cold and massive, kept even its hydrogen.
3. Why reaction rates climb so steeply with temperature
A chemical reaction usually needs the colliding molecules to arrive with more than some minimum energy — the activation energy. Only tail molecules qualify.
Take an activation energy of 50 kJ/mol, which is unremarkable, and nitrogen-sized molecules. The threshold speed works out at about 1890 m/s, and integrating the distribution above it gives:
- at 300 K: a fraction
- at 310 K: a fraction
A rise of just 10 kelvin — about 3% in absolute temperature — nearly doubles the number of molecules that can react. Meanwhile went up by a feeble 1.65%. That is the origin of the chemist's rule of thumb that reaction rates roughly double for every ten-degree rise, and it is a statement about the tail, not about the average.
Key Point: Averages change slowly with temperature, as . Tails change exponentially. Whenever a physical process has a threshold — escape from a liquid, escape from a planet, getting over an activation barrier — the rate is governed by the tail, and it will be far more temperature-sensitive than any average suggests.
The trap list for this section
- Never mix up the three speeds. , in the ratio , always.
- for energy and pressure, for mean free path and collision rate. Swapping costs 15.1% or 8.5% respectively.
- . Square first, then average — the other order is a different (and smaller) number.
- The curve is asymmetric and starts at the origin. Not a symmetric bell, and not centred on .
- Area, not height. A fraction of molecules is always an area between two speeds; the fraction at exactly one speed is zero.
- Equal areas. Curves at two temperatures, or for two gases, must enclose the same area. Hotter means flatter and wider; heavier means taller and narrower.
- in kg/mol, in kelvin. Every one of the three formulas carries the same molar-mass hazard: oxygen is , never 32.
- Only matters for the shape. Two gases with the same have identical distributions.
Solved Examples
Constants used throughout: J/K; J/(mol K); per mole; K.
Example 1: All three speeds for oxygen
Find , and for oxygen at 27°C. Molar mass of oxygen is 32 g/mol. Verify that your three answers are in the standard ratio.
Solution:
Kelvin first.
Molar mass to kilograms per mole, on its own line, always.
The common core. All three formulas share , so compute it once:
Now just attach the three coefficients.
Check the ordering and the ratio.
Final Answer: m/s, m/s, m/s.
Takeaway: Compute once and reuse it three times. The three speeds differ only by the coefficient under the root — , , — so doing the shared arithmetic once saves two-thirds of the work and removes two chances to slip.
Example 2: One speed given, the other two wanted
The rms speed of nitrogen at a certain temperature is 517 m/s. Without finding the temperature, find the average and most probable speeds.
Solution:
Use the ratio, not the formulas. Since at every temperature, the temperature is not needed and is not asked for.
Most probable speed. Divide by :
Average speed. Either multiply by , or divide by : The two routes agree, which is the check.
Sanity. , in the right order and all in the few-hundred-metres-per-second band where molecular speeds live.
Final Answer: m/s and m/s.
Takeaway: When a question gives you one of the three speeds and asks for another, the temperature and molar mass are decoration. The ratio does the whole job in one multiplication.
Example 3: Identifying a gas from its peak
The speed distribution of a certain gas at 300 K peaks at 500 m/s. Identify the gas, and find its average and rms speeds.
Solution:
The peak is , by definition. So
Square and rearrange for the molar mass.
Convert to the units a periodic table uses. That is neon. (The unit assertion holds: , so the molar mass really is in kg/mol.)
The other two speeds, straight from the ratio.
Final Answer: The gas is neon, g/mol; m/s and m/s.
Takeaway: A peak on a speed-distribution graph is , so it is a direct measurement of . Reading the peak position off an experimental curve is a genuine way to weigh a molecule — and note that the answer came out in kg/mol and had to be multiplied by 1000 to be recognisable.
Example 4: Mean square is not the square of the mean
Five molecules have speeds 200, 400, 600, 800 and 1000 m/s. Find (a) the average speed, (b) the mean square speed, (c) the rms speed, and (d) show that . Compare the ratio with the value that a full Maxwell distribution would give.
Solution:
(a) Average speed — add and divide:
(b) Mean square speed — square each, then average:
(c) Rms speed:
(d) The comparison. They differ by , and the mean square is the larger one — as it must be, because that difference is the spread of the speeds and a spread cannot be negative.
The ratio. A real Maxwell distribution gives . Ours is a little higher because five evenly spaced speeds are a wider, flatter spread than the real curve, which bunches most molecules near the peak.
Final Answer: (a) 600 m/s; (b) m/s; (c) 663.3 m/s; (d) , and against 1.0854 for a true Maxwell gas.
Takeaway: Square first, then average — never the other way round. The gap between and is the spread of speeds, which is why always sits above , for any set of numbers whatsoever.
Example 5: Choosing the speed for a collision count
Air at STP has a mean free path of m. Take the mean molar mass of air as 29 g/mol. Find the collision frequency of a molecule, using the correct speed — and then find what answer you would get with the wrong one, and by what percentage it is off.
Solution:
Kelvin and kilograms first.
Which speed? Collision frequency counts how many collisions happen per second, which means how much distance is covered per second. Distance per second is an ordinary average of speed, so this wants .
The collision frequency. and the collision time is s.
Now the wrong road. With instead:
The size of the error. The ratio is exactly , so the wrong answer is 8.5% too high — every time, for every gas, at every temperature.
Final Answer: per second using m/s. Using m/s instead gives , which is 8.5% too high.
Takeaway: The mean free path and the collision rate want ; energy and pressure want . The 447 against 485 for air at STP is worth memorising as a pair — seeing 485 in a collision-rate answer is an instant diagnosis.
Example 6: Choosing the speed for an energy
For nitrogen at 300 K, find the average translational kinetic energy per molecule two ways: correctly, from , and incorrectly, from . Take g/mol. By what percentage does the wrong route fail?
Solution:
Set up. g/mol kg/mol, and the mass of one molecule is
The two speeds at 300 K:
Correct energy, using the mean square: which is exactly at 300 K, as the previous section established.
Wrong energy, using the square of the mean:
The shortfall. The ratio of the two is , so
Final Answer: Correct: J. Using : J, which is 15.1% too low.
Takeaway: Kinetic energy is quadratic in speed, so it needs the mean of the squares. A kinetic energy computed from the average speed is always short by 15.1% — a fixed penalty, because the ratio of the two speeds is fixed.
Example 7: Matching a mean speed to an rms speed
At what temperature will the average speed of oxygen molecules equal the rms speed of hydrogen molecules at 300 K? Molar masses: oxygen 32 g/mol, hydrogen 2 g/mol.
Solution:
Convert everything first.
The target speed — hydrogen's rms speed at 300 K:
Set oxygen's mean speed equal to it. Note the two different coefficients — this is exactly the trap the question is built around:
Square and solve.
Check by going forwards. At 5655 K, oxygen's mean speed is
Final Answer: 5655 K.
Takeaway: When the two speeds being matched are of different kinds, you cannot just cancel the coefficients. Had both been rms speeds, the answer would have been K; the extra factor of that lifts it to 5655 K is precisely the -versus- difference.
Example 8: Reading fractions off a distribution
For nitrogen at 300 K ( m/s), 38.4% of molecules are slower than 400 m/s and 6.6% are faster than 800 m/s. Find (a) the fraction between 400 and 800 m/s, and (b) the fraction of molecules faster than the most probable speed. (c) A student says "the fraction of molecules moving at exactly 500 m/s is about 0.2%." What is wrong with that?
Solution:
(a) The three bands cover every possible speed, so their areas must add to 1, that is to 100%: No integration needed — just the fact that the total area is fixed.
(b) Fraction faster than . The fraction slower than is 42.8% for any gas at any temperature, since the curve simply stretches and the marker stretches with it. So Note what this says: more than half the molecules are faster than the most probable speed. The curve's long right tail is why.
(c) The student's error. "Exactly 500 m/s" is a single point on the speed axis, a range of zero width. The fraction of molecules in it is the area of a strip of zero width, which is zero. is a fraction per unit speed range, not a fraction; to get a number you must specify a band, such as "between 499 and 501 m/s".
Final Answer: (a) 55.0%; (b) 57.2%; (c) the fraction at exactly one speed is zero — a distribution gives fractions only over ranges.
Takeaway: Total area is 1, so complementary fractions are a subtraction, not an integral. And "what fraction has speed exactly " is always zero: read areas, never heights.
Example 9: What heating does to the whole curve
A sealed vessel of nitrogen is heated from 300 K to 1200 K. Describe what happens to (a) the most probable speed, (b) the height of the peak, (c) the area under the curve, and (d) the fraction of molecules faster than 1000 m/s, which is 1.06% at 300 K and 42.24% at 1200 K.
Solution:
(a) The most probable speed. , and the temperature has gone up four times, so The peak moves right, and it exactly doubles.
(b) The height of the peak. The peak height goes as , so it halves. In the figure earlier in this section it drops from about to about per (m/s).
(c) The area. Unchanged, at exactly 1. The vessel is sealed, so not one molecule has been created or destroyed. This is the reason (a) and (b) had to move in opposite directions: the curve got twice as wide, so it had to get half as tall.
(d) The tail. Nearly forty times as many molecules are now above 1000 m/s. Compare that with the speeds themselves, which merely doubled.
The moral. Multiplying by 4 doubles every characteristic speed but multiplies the population of a fixed high-speed band by about 40. Tails are exponential; averages are only square-root.
Final Answer: (a) doubles, 422 m/s to 844 m/s; (b) halves; (c) unchanged at 1; (d) grows by a factor of about 40.
Takeaway: Heating spreads molecules out; it does not make more of them. Right-and-down is the only way a normalised curve can move when it is heated, and any graph showing a hotter curve that is taller as well as wider is wrong.
Example 10: Why the atmosphere kept nitrogen and lost hydrogen
At an exospheric temperature of 1000 K, find the most probable speed of hydrogen (2 g/mol) and of nitrogen (28 g/mol), and compare each with Earth's escape speed of km/s. Given that the fraction of molecules faster than the escape speed is about for hydrogen and about for nitrogen, explain the composition of our atmosphere.
Solution:
Convert, and check the kelvin. K is already absolute. kg/mol and kg/mol, both safely less than 1 as a molar mass in kg/mol must be.
Most probable speeds.
How far out on the tail is the escape speed?
Read those against the tail table. At about 3.9 times the most probable speed, hydrogen still has roughly one molecule in a million above the line. At 14.5 times, nitrogen's fraction is around — a number so small that in the entire age of the Earth, with molecules trying, not one would make it.
The consequence. Collisions constantly refill the tail, so hydrogen's one-in-a-million leaks away continuously and, over billions of years, completely. Nitrogen and oxygen never get a chance. Earth's atmosphere is 78% nitrogen and 21% oxygen with essentially no free hydrogen or helium, and the reason is the position of the escape speed on the Maxwell tail.
Final Answer: m/s for hydrogen and 771 m/s for nitrogen; the escape speed is 3.9 times the first and 14.5 times the second, which is the difference between leaking away and staying forever.
Takeaway: Atmospheric escape is decided by where sits in units of , not by whether the average molecule can escape. No average molecule ever escapes from anywhere; the tail does all the work.
Example 11: Two gases with the same distribution
(a) At 300 K, oxygen has some speed distribution. At what temperature would helium have exactly the same distribution curve? (b) Separately: for two gases A and B at the same temperature, of A equals of B. Find . Molar masses: oxygen 32 g/mol, helium 4 g/mol.
Solution:
(a) What fixes the curve. Every speed in the distribution goes as , and the curve's shape depends on nothing else. Two gases share a curve when they share :
Check it. for helium at 37.5 K is m/s, which is exactly oxygen's at 300 K. The curves are identical.
(b) Setting an rms speed equal to a most probable speed. Same temperature, so cancels, but the coefficients do not:
Square both sides and cancel :
Does it make sense? has the bigger coefficient, so to bring it down to B's most probable speed, gas A must be the heavier one — and indeed .
Final Answer: (a) K; (b) .
Takeaway: Only the combination shapes the curve — so a light gas at low temperature can be an exact stand-in for a heavy gas at high temperature. And when you equate two different kinds of speed, carry the coefficients , , through; they are the whole content of the question.
Example 12: The 10-degree rule for reaction rates
A reaction needs colliding molecules to arrive with a translational kinetic energy above 50 kJ/mol. For a gas of molar mass 28 g/mol, (a) find the threshold speed, and (b) given that the fraction of molecules above that speed is at 300 K and at 310 K, comment on how the reaction rate responds to a 10-degree rise, and contrast it with what happens to .
Solution:
(a) Get the threshold energy per molecule. The 50 kJ/mol is per mole, so divide by :
Mass of one molecule:
Set and solve for the speed: For reference, at 300 K is only 517 m/s, so the threshold sits at about — deep in the tail, which is why the fractions are around .
(b) The effect of 10 kelvin. The number of molecules able to react nearly doubles.
Now the contrast. Over the same 10 K, a rise of just 1.65%.
The point. A 1.65% change in the average produced an 89% change in the tail population. This is the origin of the familiar rule that reaction rates roughly double for every ten-degree rise in temperature, and it is a statement about the shape of the Maxwell tail, not about how fast the average molecule is going.
Final Answer: (a) m/s; (b) the reactive fraction nearly doubles (factor 1.89) while rises by only 1.65%.
Takeaway: Any process with a threshold is governed by the tail, and tails are exponentially sensitive to temperature. Whenever a rate changes far faster with temperature than would suggest, look for a threshold and a Maxwell tail behind it.