
A Process, and the One Idealisation That Makes It Drawable
So far this chapter has been algebra. From here it becomes a picture, and once you can read the picture most of the rest of the chapter stops being hard.
What a thermodynamic process is
Key Point — thermodynamic process:
A thermodynamic process is any change that takes a system from one equilibrium state to another. The starting state and the finishing state are each described completely by a few state variables — for a fixed amount of gas, any two of , and , since the third follows from .
Notice what that definition does not say. It says nothing about what happened in between. And that turns out to be the whole difficulty.
Before going on, fix the bookkeeping, because this section is about signs more than anything else.
This chapter's sign convention: is positive when heat is added TO the system. is positive when work is done BY the system. The first law is then
Chemistry writes the first law as , with the work done on the system — identical physics, one sign moved.
The trouble with real processes
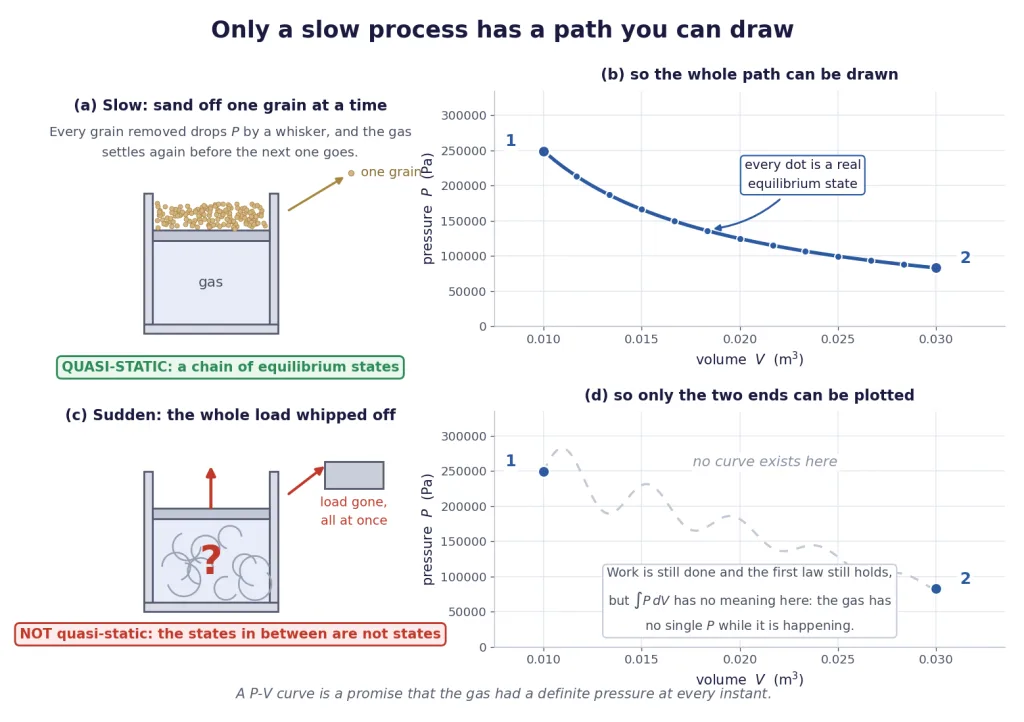
Take a cylinder of gas under a heavy piston, and whip the whole load off in one go.
The piston flies outward. For the next fraction of a second the gas next to the piston is at a much lower pressure than the gas at the bottom of the cylinder; there are eddies and pressure waves; one part is cooler than another. Ask "what is the pressure of the gas?" and there is no answer, because there isn't one pressure. Ask for its temperature and it is the same story.
A system in that condition has no state variables at all. You cannot put a point on a graph for it, because a point needs a and a , and it has neither. Eventually the gas settles down, and then it has both again — but everything in between is off the map.
The quasi-static idealisation
So we invent an idealised way of doing the same job.
Key Point — quasi-static process:
A quasi-static process is one carried out so slowly that at every instant the system is in thermal and mechanical equilibrium with its surroundings. At every stage the difference between the system's pressure and the external pressure is infinitesimal, and so is any temperature difference.The name means "nearly static". Such a process is, strictly, infinitely slow — it is a hypothetical construct, never exactly achieved.
Picture it as the left-hand cylinder in the figure. Instead of one heavy load, cover the piston with fine sand and take the grains off one at a time. Each grain removed drops the external pressure by a whisker; the gas expands by a whisker and re-equilibrates long before the next grain goes. At every instant the gas has a definite, uniform pressure and a definite, uniform temperature.
That is the point of the whole idea:
Key Point — why quasi-static matters:
In a quasi-static process the system passes through a continuous chain of equilibrium states, so , and are defined at every instant. Only then does the process have a path that can be drawn on a graph — and only then can the work be worked out as an integral.
How slow is slow enough?
"Infinitely slow" sounds useless, but in practice the bar is low. What matters is that the process is slow compared with the time the gas takes to even itself out, and that time is set by how fast a pressure disturbance crosses the container — roughly the speed of sound. A 20 cm cylinder evens out in about half a millisecond. So a piston moving at ordinary speeds, taking a tenth of a second to travel its stroke, is quasi-static to excellent accuracy.
This is why the idealisation earns its keep instead of being a cheat: almost every process an engine performs is quasi-static enough to draw.
[JEE Tip] Two processes named in this chapter are famously not quasi-static, and examiners love them for exactly that reason: the free expansion of a gas into a vacuum, and any explosive or sudden change. For those, the endpoints are legitimate states and the first law still applies between them — but there is no curve, and is meaningless because there is no single to integrate. Any question that asks you to "find the work done from the graph" for a sudden expansion is testing whether you noticed.
And the vocabulary that goes with it
Four special quasi-static processes get names, from what is held fixed:
- isothermal — the temperature is constant;
- isobaric — the pressure is constant;
- isochoric (also called isovolumic) — the volume is constant;
- adiabatic — no heat crosses the boundary at all, .
Sections 6 and 7 take these apart one by one and supply the formulas. This section is about the diagram they all live on.
The - Diagram, and the Idea the Whole Chapter Rests On
The diagram
Put volume on the horizontal axis and pressure on the vertical axis. Then, for a fixed amount of gas:
- every equilibrium state is a single point. Two coordinates, and , fix the state completely, because follows from . A point on this plane is a complete description of the gas.
- every quasi-static process is a curve joining two such points, because the gas passes through a continuous chain of equilibrium states.
- an arrowhead on the curve says which way the process ran, and it matters enormously.
This is also called an indicator diagram, a name it earned in the age of steam, when a mechanical linkage drew exactly this graph on a rotating drum bolted to a working engine, so an engineer could read a real cylinder's performance straight off the paper.
Now the result everything else follows from
Section 2 showed that when a gas expands by a small amount against a pressure , the work it does is Add up all the small contributions along a path from state to state :
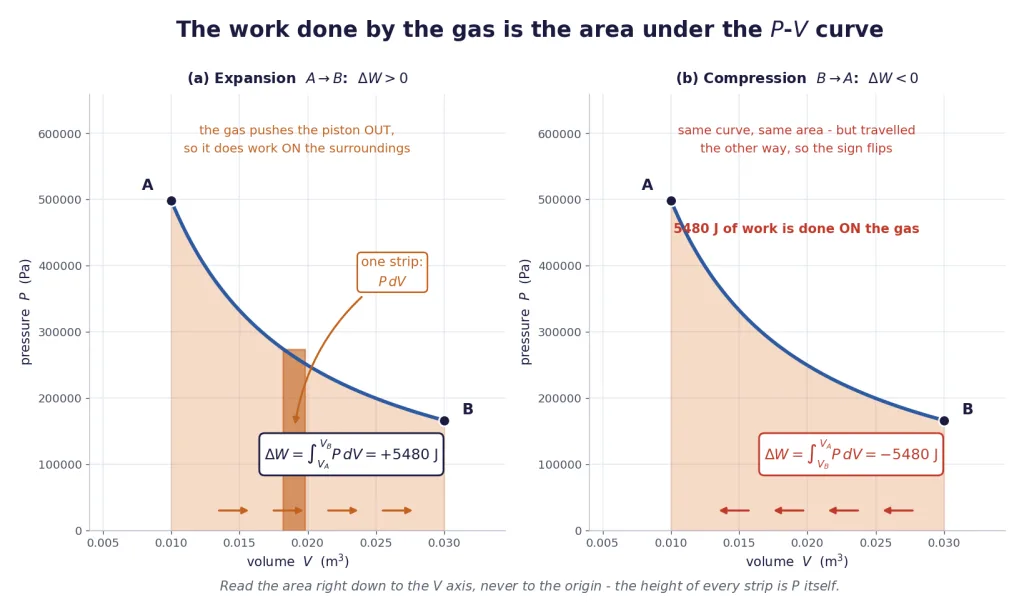
Look at what that integral is on the diagram. is the height of the curve. is a sliver of width along the volume axis. So is the area of one thin vertical strip under the curve, and the integral adds up all the strips.
Key Point — the central result of this section:
The work done by a gas in a quasi-static process is the AREA UNDER its curve on the - diagram, measured down to the volume axis.
That the work is the area under the - curve, and everything that follows from it, sits outside the rationalised syllabus body text, yet it is asked in Boards, JEE and NEET every year and it is the single most useful idea in the chapter, so it is developed here from first principles.
Reading the sign off the picture
The integral runs from the starting volume to the finishing volume, and that is what carries the sign.
Key Point — the sign of the work:
- Expansion (): the gas pushes its surroundings back, is positive, work is done BY the gas.
- Compression (): the surroundings push the gas in, is negative, work is done ON the gas.
- Constant volume (): the path is a vertical line, it encloses no area at all, and — however violently the pressure changes.
The two panels of the figure make the point sharply: the same curve traced in the opposite direction has the same area but the opposite sign. The area is a number; the direction of travel supplies the sign. Never write "the work done is 5480 J" without saying by the gas or on the gas.
Three habits that stop most of the errors
Measure down to the axis, never to the origin. The height of every strip is itself, so the strip runs from up to the curve. Beginners sometimes shade a triangle out to the corner of the graph; there is no such rule.
Check the units before you trust the number. Areas on this diagram come out in joules only if is in pascals and is in cubic metres. Exam graphs are almost always drawn in kilopascals and litres, and the conversion is a gift: So an area of 400 squares on a kPa-against-litre grid is 400 J exactly. But an area read off a graph in atmospheres and litres is not in joules — 1 atm L J.
A vertical line has zero area. This sounds obvious until it appears as one leg of a four-leg cycle and someone tries to compute work for it anyway.
[Board Important] The full-mark statement is one sentence with three parts: the work done by a gas in a quasi-static process equals the area under the - curve, taken down to the volume axis, positive for an expansion and negative for a compression. Draw the shaded region and label its sign; a shaded diagram usually carries a mark of its own.
[NEET Important] If a graph is a straight line, you do not need calculus at all. The area of a rectangle, a triangle or a trapezium does the job, and the trapezium rule gives for any straight-line path — the mean pressure times the change in volume.
Why the Path Matters: Work Is Not a Property of the Endpoints
Here is the payoff, and it is the reason the last block was worth the trouble.
The experiment on paper
Take one mole of a diatomic ideal gas from state , at Pa and m, to state , at Pa and m. Both states are fixed; only the route between them is open to choice. Try three routes.
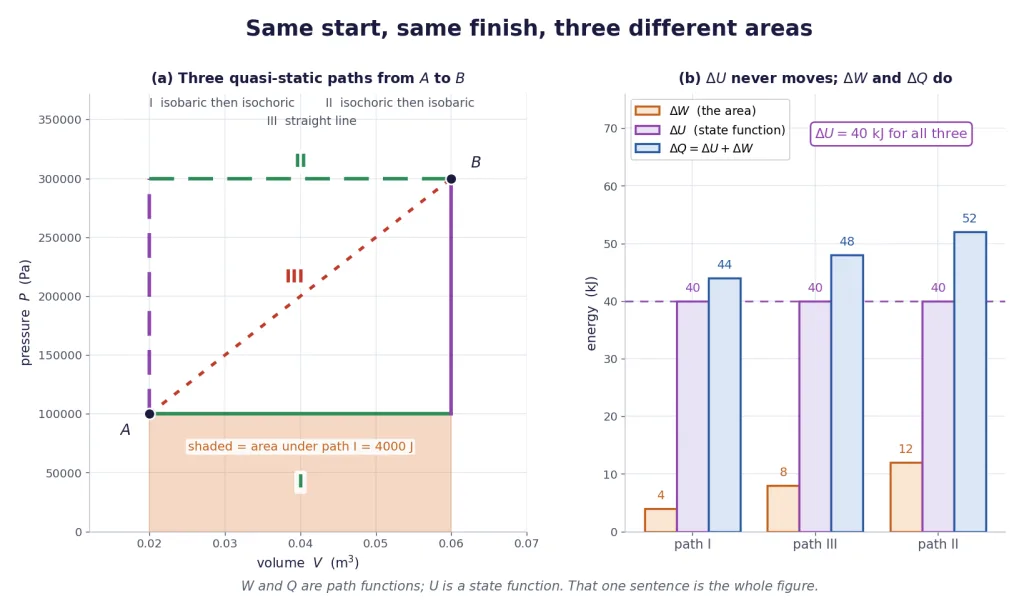
Path I — expand first, then pressurise. Hold the pressure at Pa while the volume goes from to m, then hold the volume fixed while the pressure is raised to Pa. The first leg is a horizontal line with a rectangle under it; the second is a vertical line with no area.
Path II — pressurise first, then expand. Now the vertical leg comes first and contributes nothing, and the horizontal leg happens at the higher pressure.
Path III — a straight line from to . The area is a trapezium, so use the mean pressure:
Same start. Same finish. Three answers: 4000 J, 8000 J and 12 000 J. The picture tells you why instantly — the three curves fence off three different areas.
Key Point — work is a path function:
depends on how the system got from one state to the other, not merely on where it started and finished. So it is meaningless to talk about "the work of a state". There is no quantity stored in a gas that you could subtract; only a for a particular path.
The other half of the story
Now compute the internal energy change. For an ideal gas , so both absolute and positive, as every temperature entering a gas-law step must be. With J/(mol K) for a diatomic gas,
And that is the answer for all three paths. is a state function; is fixed the moment the two endpoints are fixed. The path is irrelevant.
Feed both into the first law:
| Path | (J) | (J) | (J) |
|---|---|---|---|
| I — isobaric then isochoric | |||
| III — straight line | |||
| II — isochoric then isobaric |
Every is positive — heat was added on every route. Every is positive — the gas expanded on every route. But the amounts differ, and they differ together, because has to come out the same.
Key Point — the asymmetry at the heart of thermodynamics: Their sum is path-independent even though neither term is. Take a different route and you change the heat and the work by exactly the same amount, so that the difference survives.
The difference between two paths is an area
Look again at the numbers. Path II beats path I by and the region fenced in between the two paths is a rectangle Pa tall and m wide:
Identical, and not by accident. The extra work along one path over another is exactly the area enclosed between them. Hold on to that: in the next block the two paths are joined into a loop, and that same enclosed area becomes the net work of a heat engine.
[JEE Tip] The exam version of this idea is almost always: "a gas is taken from to along two different paths; along which is more heat absorbed?" You do not need any numbers. is the same for both, so whichever path has the larger area under it has the larger , and therefore needs the larger . Answer straight off the picture.
Closed Loops: The Enclosed Area Is the Net Work
Join two different paths end to end and the system comes back to where it started. That is a cyclic process, and it is how every engine on earth works.
What closing the loop does
Return to the starting state and every state variable returns to its starting value — pressure, volume, temperature, and above all internal energy. So
Key Point — the cyclic consequence:
Round any closed cycle, Whatever net heat goes in comes out as net work, exactly. A cycle stores nothing.
And the area does the counting
Walk a loop and the work is the area under the outward part of the journey minus the area under the return part, because the return runs the other way and its area counts negative. What survives is the region between the two branches.
Key Point — the enclosed area:
For a closed loop on a - diagram, and, because , that same area is also the net heat absorbed.
Which way round? The sign rule
Everything hangs on the direction of travel, and the rule is worth burning in.
Key Point — the direction rule:
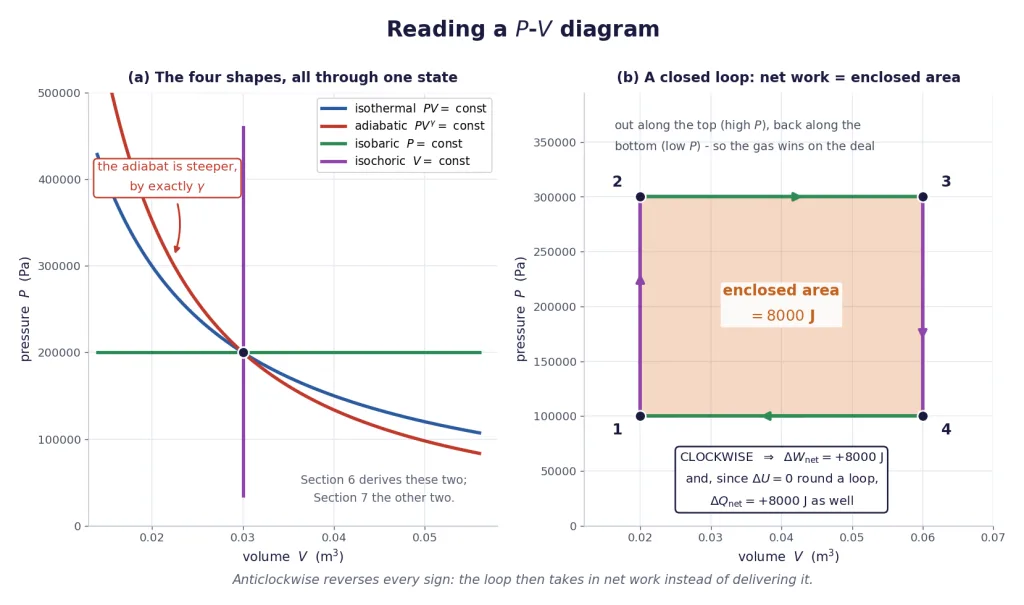
- Clockwise loop: is positive. The gas does net work on its surroundings, and absorbs net heat to pay for it. This is a heat engine.
- Anticlockwise loop: is negative. Net work is done on the gas, and it rejects net heat. This is a refrigerator or heat pump.
The reason is visible on the diagram, not something to memorise blindly. Going clockwise means the gas expands along the upper branch, where the pressure is high, and is pushed back along the lower branch, where the pressure is low. Expanding against a high pressure earns more than compressing against a low one costs, so the gas comes out ahead. Run the loop the other way and it loses on exactly the same deal.
Working a loop, leg by leg
The discipline that turns the hardest cycle questions into arithmetic is a three-column table. Take the rectangular loop in the figure, with one mole of a diatomic gas, J/(mol K):
| State | (Pa) | (m) | (K) |
|---|---|---|---|
| 1 | 0.020 | 240.6 | |
| 2 | 0.020 | 721.7 | |
| 3 | 0.060 | 2165.0 | |
| 4 | 0.060 | 721.7 |
Every temperature is absolute and positive. Now the legs:
| Leg | Type | (J) | (J) | (J) |
|---|---|---|---|---|
| vertical, fixed | ||||
| horizontal, fixed | ||||
| vertical, fixed | ||||
| horizontal, fixed | ||||
| Totals |
Three checks, and you should run all three every time:
- The column sums to zero. It must, round any loop. If it does not, a temperature is wrong.
- . Here both are J.
- The net work equals the enclosed area. The rectangle is Pa tall and m wide, so its area is J. It matches, and the loop runs clockwise, so the sign is positive.
Read the signs physically as well as numerically. Heat went in on legs and , a total of J. Heat came out on legs and , a total of J. The difference, J, left as work. That is a heat engine, and Section 9 gives it its proper vocabulary.
The ledger is doing one job here — showing that the enclosed area really is the net work. Section 7 turns it into a standard method, with the work and heat formulas for each kind of leg, and runs it on cycle after cycle.
[JEE Tip] For a loop made only of straight segments you can skip the leg-by-leg work entirely and just find the enclosed area geometrically — a rectangle, a triangle, a trapezium. Then attach the sign from the direction of travel. You will still need the table if the question asks for the heat on an individual leg, but for "find the net work done in the cycle" the area is a five-second answer.
Reading a Diagram Fluently
The last skill is recognition: glance at a diagram and know what is happening without deriving anything.
Recognising the four shapes
| On the diagram | What is constant | Which process | ||
|---|---|---|---|---|
| horizontal line | pressure | isobaric | area of a rectangle; sign from the direction | changes with |
| vertical line | volume | isochoric | zero — no area at all | changes with |
| hyperbola, constant | temperature | isothermal | area under the curve | zero, for an ideal gas |
| steeper hyperbola, constant | no heat exchanged | adiabatic | area under the curve | , since |
The one that needs care is telling an isotherm from an adiabat, because both fall away to the right. Through any given point the adiabat is always the steeper of the two — steeper by exactly the factor , which is why is called the adiabatic index. The first panel of the figure in the previous block plots both through the same state so you can see it. Section 6 proves it.
Sections 6 and 7 supply the work and heat formulas for all four. Here we only need to recognise them.
Where the heat is going
You can read the energy flow off any segment with two questions.
Is the temperature rising? Compare at the two ends, since for a fixed amount of gas. If has grown, has risen, so is positive. This is why the corner of a - diagram furthest from the origin is always the hottest state.
Is the gas expanding? If has grown, is positive.
Then settles the third. A few standing cases:
- Moving right along a horizontal line — expanding at constant pressure. up, so up, so up. and , therefore : heat must be supplied.
- Moving up a vertical line — pressurising at constant volume. and up, so : heat supplied, and all of it stays inside.
- Moving right along a hyperbola — expanding isothermally. , so : all the heat supplied leaves again as work.
- Moving right along the steeper curve — expanding adiabatically. , so : no heat at all, and the gas cools itself.
Why the - plane and not another
Nothing stops you plotting against , or against , and both are occasionally useful — an isochoric process, for instance, is a straight line through the origin on a - plot, which makes it easy to spot.
But the - plane has a property no other has. Only there is the work equal to an area, because only there does the product of the two axes have the dimensions of energy: On a - or a - plot an area is not an energy and means nothing at all. That is the whole reason this one diagram runs the chapter.
The checklist before you answer anything
- Which way do the arrows point? Rightward means expansion and positive work; leftward means compression and negative work; a loop clockwise is positive, anticlockwise negative.
- Are the axes in pascals and cubic metres? If they are in kilopascals and litres, the area is already in joules. If they are in atmospheres, convert: 1 atm Pa.
- Is the process quasi-static? If it is drawn as a curve, yes, by construction. If the question describes a sudden or free expansion, there is no curve and the area method does not apply.
- Is it a closed loop? Then and the enclosed area.
- Say by or on. A work answer without that word is not an answer.
Key Point — the four sentences to carry out of this section:
- Only a quasi-static process has a curve at all.
- The work done by the gas is the area under that curve, down to the axis.
- Different paths between the same two states enclose different areas, so and are path functions while is not.
- A closed loop encloses an area equal to the net work — positive clockwise, negative anticlockwise.
Solved Examples
Constants used throughout: J/(mol K); 1 atm Pa; K; for a diatomic gas J/(mol K). Remember that kPa L J exactly.
Example 1: The simplest area of all
A gas expands at a constant pressure of Pa from m to m. Sketch the path and find the work done.
Solution:
The path. Constant pressure means a horizontal line on the - diagram, running left to right because the gas expands.
The area under it is a rectangle of height and width :
The sign. , so the gas expanded and is positive: 4000 J of work was done by the gas on its surroundings.
Final Answer: J, done by the gas.
Takeaway: For a horizontal path the area is just — and the sign comes free from whether is positive or negative. Never write the bare number without saying by or on.
Example 2: The same picture, run backwards
A gas is compressed at a constant pressure of Pa from m to m. Find the work done by the gas, and the work done on the gas.
Solution:
The change in volume is negative:
Feed that straight into the integral — the sign is carried by the limits, so do not strip it out:
Read both statements. J means the work done by the gas is negative. Equivalently, the work done on the gas by whatever pushed the piston in is J.
Sanity check against the picture. The area under the path is 4500 J either way — the number is the same as if the gas had expanded along the identical line. Only the direction of travel differs, and that is what supplies the minus sign.
Final Answer: J by the gas; equivalently J is done on the gas.
Takeaway: Keep the sign inside and let the arithmetic carry it. Taking a modulus and "putting the sign back at the end" is where compressions go wrong.
Example 3: An area straight off a graph in kilopascals and litres
A gas is taken round a triangular cycle whose vertices are , and , traversed in that order and back to the start. Find the magnitude of the net work.
Solution:
Do not convert yet. On a graph of kilopascals against litres, one square of kPa by L is so the area in kPa L is the work in joules.
The triangle has a vertical side from 100 to 300 kPa (a base of 200 kPa) and a horizontal side from 2 to 6 L (a height of 4 L):
Check it in SI, since it is the first time: base Pa, height m, so area J. Agreed.
The direction. Going traces the triangle clockwise, so the net work is positive: J done by the gas, and since round a loop, J was absorbed.
Final Answer: J; running clockwise, J.
Takeaway: 1 kPa L = 1 J. Learn it and half the graph questions in this chapter become mental arithmetic. But 1 atm L J, so check the pressure unit before you use the shortcut.
Example 4: A sloping path
A gas is taken along the straight line with Pa/m, from m to m. Find the pressures at the two ends and the work done.
Solution:
The endpoints:
Integrate along the path, since is not constant:
Check with the trapezium shortcut. The path is straight, so the mean pressure works:
The sign is positive — the gas expanded and did 8000 J of work on its surroundings. Note that the gas got much hotter on the way: grew from to , so grew ninefold.
Final Answer: Pa, Pa, J.
Takeaway: For any straight-line path, mean pressure times change in volume. Reach for calculus only when the path is genuinely curved.
Example 5: The area under a hyperbola
Two moles of an ideal gas at 300 K expand isothermally from m to m. Find the pressures at the two ends and the work done, by evaluating the area under the curve.
Solution:
The temperature is absolute and positive, 300 K. The path satisfies J, a constant — a rectangular hyperbola.
The two pressures:
The area under the curve. Here genuinely varies, so integrate:
The signs, all three. J, so the gas did work on its surroundings. The temperature did not change, so for an ideal gas . The first law then forces so 5480 J of heat entered the gas and left again immediately as work, banking nothing.
A useful cross-check. The straight-line (trapezium) estimate would give J, which is too big — as it must be, because a hyperbola sags below its own chord. If your curved-path answer ever exceeds the trapezium estimate for a convex curve, something is wrong.
Final Answer: Pa, Pa, J, .
Takeaway: A curved path needs the integral, but the trapezium still bounds it. Section 6 derives properly; here it is simply the area under this particular curve.
Example 6: Three routes, one destination
One mole of a diatomic ideal gas goes from at to at by three routes: I isobaric then isochoric, II isochoric then isobaric, III a straight line. Find , and for each.
Solution:
first, because it is the same for all three. Temperatures from , both absolute and positive:
Path I. The horizontal leg at the low pressure carries all the area; the vertical leg carries none:
Path II. The vertical leg comes first and contributes nothing; the horizontal leg happens at the high pressure:
Path III. Straight line, so use the mean pressure:
Heat, from the first law, path by path:
Signs. On every route (heat added), (the gas ended much hotter) and (the gas expanded). What changes between routes is the split, never the total .
Final Answer: kJ for all three; , , kJ and , , kJ for I, III and II.
Takeaway: Compute once from the endpoints, then read off the graph for each path, then let the first law give . That order never fails.
Example 7: Which route costs more heat, without any numbers?
Using the same two states and as above, and without computing : which of paths I and II requires more heat, and by exactly how much?
Solution:
Write the first law for each path and subtract: The cancels because it is the same for both paths — that single fact is the whole solution.
So the difference in heat is the difference in area, which is the region fenced in between the two paths — here a rectangle:
Confirm against Example 6: J. Agreed.
The general rule. Between the same two states, the path with the larger area under it always needs the larger heat input, and the excess is exactly the area enclosed between the two paths.
Final Answer: Path II needs J more heat, which is the area enclosed between the two paths.
Takeaway: You can compare two paths without knowing , the gas, or even the number of moles. This is the fastest question type in the chapter once you see it.
Example 8: Two paths, and nothing but the first law
A gas is taken from state to state along path 1, absorbing 60 J of heat and doing 40 J of work. It is then returned from to along path 2, during which 30 J of work is done on the gas. (a) Find from to . (b) Find the heat exchanged along path 2, and say which way it flowed. (c) A third path from to has the gas doing 10 J of work; find the heat absorbed along it. (d) Check the round trip.
Solution:
Nothing here needs a graph, a gas law or a specific heat. It is the first law and the state-function property, and that is the point.
(a) Path 1, . Both given quantities are positive: heat was added and the gas did work. Positive, so state holds 20 J more internal energy than state . That number now belongs to the pair of states, not to path 1.
(b) Path 2, . Going backwards, the internal energy change simply reverses: Work done on the gas is 30 J, so with our convention the work done by the gas is Then Negative, so heat left the system: 50 J was rejected to the surroundings along path 2.
(c) A third path, . is again J, because the endpoints are the same. With J, Positive: 30 J absorbed. Compare with 60 J on path 1 — half as much heat, because the gas did a quarter as much work. never moved.
(d) The round trip by path 1, then by path 2, is a closed cycle: The two agree, as demands. The loop delivers 10 J of work per cycle, so on a diagram it would run clockwise and enclose an area of 10 J.
Final Answer: (a) J; (b) J, heat rejected; (c) J absorbed; (d) and J.
Takeaway: Get from whichever path you were told the most about, then reuse it on every other path. "Work done on the gas is 30 J" means J — translate it the moment you read it.
Example 9: A four-sided loop read off a graph
A gas is taken clockwise round the loop whose corners are , , and , with a straight line. Find the work on each leg and the net work, and check it against the enclosed area. Then say what changes if the loop is run anticlockwise.
Solution:
Units. The axes are kilopascals and litres, so every area read off this grid is already in joules: kPa L J.
Leg , vertical: the volume does not change, so .
Leg , a straight line from 300 kPa down to 200 kPa while the volume grows from 2 L to 6 L. Use the mean pressure: Positive: the gas expanded.
Leg , vertical again: .
Leg , horizontal at 100 kPa, compressing from 6 L back to 2 L: Negative: work done on the gas.
Net work:
Check against the enclosed area. The loop is a trapezium standing on the 100 kPa line, with a left side 200 kPa tall (from 100 to 300), a right side 100 kPa tall (from 100 to 200) and a width of 4 L: The loop runs clockwise, so the sign is positive: the gas does 600 J of net work per cycle, and since round any loop, it absorbs a net 600 J of heat.
Run anticlockwise and every leg reverses. The area is unchanged at 600 J, but so 600 J of work must be supplied and 600 J of heat is rejected. Clockwise, the loop is an engine; anticlockwise, it is a refrigerator.
Final Answer: , , , J on the four legs; J clockwise, J anticlockwise.
Takeaway: Add the legs, then check the total against the geometric area, then attach the sign from the arrows. If the two disagree, one leg has the wrong sign — almost always the return leg.
Example 10: Reading heat in and heat out off a loop
For the rectangular cycle worked in the notes — one mole of a diatomic gas round — rank the four states by temperature, identify which legs absorb heat and which reject it, and confirm the totals against the net work of J.
Solution:
Rank by temperature without computing anything. For a fixed amount of gas , so just multiply the coordinates: So : state 3 is the hottest and state 1 the coldest, and states 2 and 4 are at the same temperature even though they sit at opposite corners. In kelvin, , , and — all absolute and positive.
Which legs absorb heat? Use the two questions from the notes. On , grows so , and , so : heat in. On , both and grow, so and : heat in, and a lot of it.
Which reject? On , falls at fixed volume, so with : heat out. On , falls and the gas is compressed, so and : heat out.
The totals, from the leg values tabulated in the notes:
Read it as a machine. 52 kJ of heat is taken in from something hot, 44 kJ is dumped into something cold, and the 8 kJ difference comes out as useful work. That is a heat engine in one sentence, and Section 9 gives it its vocabulary.
Final Answer: ; heat enters on and (52 kJ in total) and leaves on and (44 kJ), and the difference of 8 kJ is the net work.
Takeaway: Multiply by at each corner and you have ranked the temperatures. Equal products mean equal temperatures, so those two states lie on one isotherm.
Example 11: The expansion with no curve at all
An insulated, rigid container is divided by a partition. One half holds one mole of an ideal gas; the other half is evacuated. The partition is suddenly removed and the gas fills the whole container, doubling its volume. Find , , and , and explain why this process cannot be drawn on a - diagram.
Solution:
The work. The gas expands into a vacuum, so there is nothing on the other side to push against — the external pressure is zero throughout: Doubling the volume makes no difference; work needs something to push.
The heat. The container is insulated, so
The first law then gives: and since of an ideal gas depends only on , The gas ends at exactly the temperature it started at, despite having doubled its volume.
Why no curve exists. The moment the partition goes, the gas rushes into the empty half. For a while the two halves are at completely different pressures and there is no single for the gas at all. Those intermediate conditions are not equilibrium states, so they are not points on the diagram, and there is nothing to join up. Only the initial and final points can be plotted.
A warning about the shortcut. Because the endpoints are at the same temperature, the two points do happen to lie on one isotherm. It is tempting to compute the area under that isotherm, , and call it the work. That is wrong: the gas never went along the isotherm. The area method applies to quasi-static paths only, and this process is emphatically not one.
Final Answer: , , and ; no path exists, so no area can be read.
Takeaway: Free expansion: zero work, zero heat, zero temperature change — and no curve. It is also irreversible, which Section 8 takes up.
Example 12: Reading a diagram cold
A gas is taken along four segments in turn: (a) rightward along a horizontal line; (b) upward along a vertical line; (c) rightward along a hyperbola with constant; (d) leftward along a curve steeper than that hyperbola, with . For each, state the signs of , and .
Solution:
Use two questions on each segment: has grown (that fixes ), and has grown (that fixes , since ). Then the first law gives .
(a) Rightward, horizontal — isobaric expansion. up at constant , so up and up. , , therefore : heat must be supplied.
(b) Upward, vertical — isochoric pressurisation. fixed, so no area and . up at constant means up, so and : heat supplied, all of it stored internally.
(c) Rightward along constant — isothermal expansion. up, so . unchanged, so and . Then : all the heat supplied leaves again as work.
(d) Leftward along the steeper curve — adiabatic compression. down, so : work is done on the gas. by definition. Then : the gas heats up with no heat entering at all. The steeper curve is the giveaway that the process is adiabatic rather than isothermal, since an adiabat through any point is steeper than the isotherm by the factor .
Final Answer: (a) ; (b) ; (c) ; (d) , in the order , , .
Takeaway: Two questions settle any segment: did the volume grow, and did grow? Everything else is the first law.